
Table 5.
Reasons for perceived decreases and increases in frequency of cannabis use from pre-closure to post-closure-1
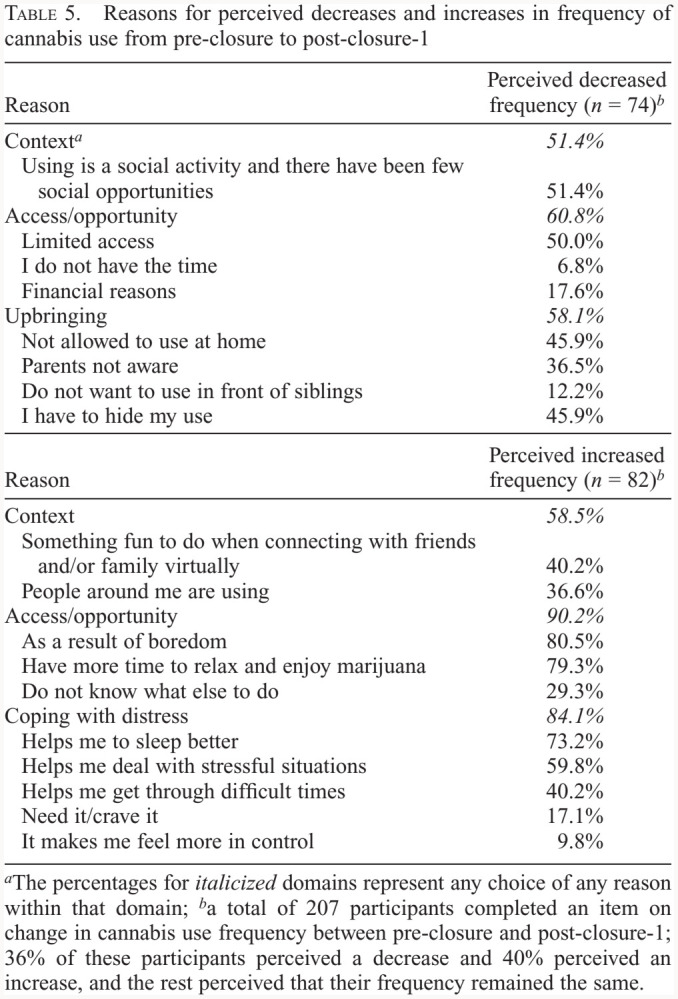
| Reason | Perceived decreased frequency (n = 74)b |
|---|---|
| Contexta | 51.4% |
| Using is a social activity and there have been few social opportunities | 51.4% |
| Access/opportunity | 60.8% |
| Limited access | 50.0% |
| I do not have the time | 6.8% |
| Financial reasons | 17.6% |
| Upbringing | 58.1% |
| Not allowed to use at home | 45.9% |
| Parents not aware | 36.5% |
| Do not want to use in front of siblings | 12.2% |
| I have to hide my use | 45.9% |
| Reason | Perceived increased frequency (n = 82)b |
| Context | 58.5% |
| Something fun to do when connecting with friends and/or family virtually | 40.2% |
| People around me are using | 36.6% |
| Access/opportunity | 90.2% |
| As a result of boredom | 80.5% |
| Have more time to relax and enjoy marijuana | 79.3% |
| Do not know what else to do | 29.3% |
| Coping with distress | 84.1% |
| Helps me to sleep better | 73.2% |
| Helps me deal with stressful situations | 59.8% |
| Helps me get through difficult times | 40.2% |
| Need it/crave it | 17.1% |
| It makes me feel more in control | 9.8% |
a
The percentages for italicized domains represent any choice of any reason within that domain;
b
a total of 207 participants completed an item on change in cannabis use frequency between pre-closure and post-closure-1; 36% of these participants perceived a decrease and 40% perceived an increase, and the rest perceived that their frequency remained the same.