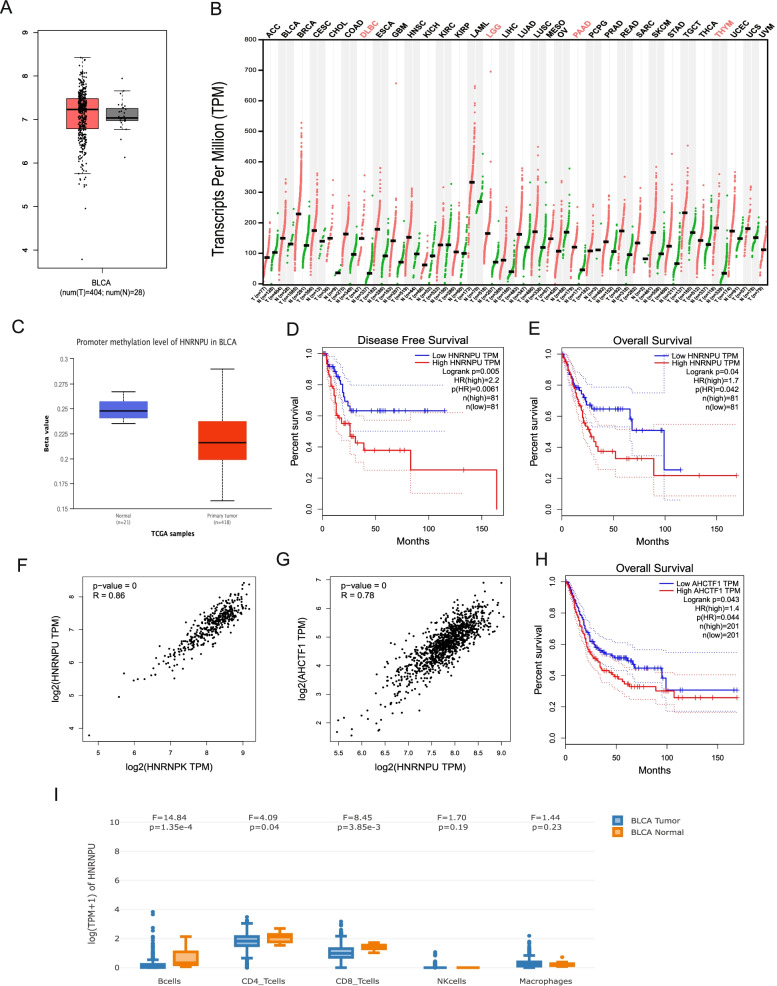
Fig. 5.
TCGA bladder cancer cohort analysis on HNRNPU expression and its impact on survival. (A) Expression profile of HNRNPU in bladder tumors versus control tissues in TCGA dataset. (B) Pan-cancer analysis of HNRNPU expression in multiple cancer types. (C) Promoter methylation level of HNRNPU in TCGA dataset (D). Disease free survival analysis of high HNRNPU patients versus low HNRNPU patients. (E) Overall survival analysis of high HNRNPU patients versus low HNRNPU patients (high = top 20%). (F) Co-expression correlation between HNRNPU and HNRNPK. (G) Co-expression correlation between HNRNPU and AHCTF1; R = Pearson’s r (H) Overall survival analysis between AHCTF1 high patients versus AHCTF1 low patients (high = top 50%). (I) Expression profile of HNRNPU in TCGA bladder cancer immune cell subsets. GEPIA2021 was used to generate the plot

