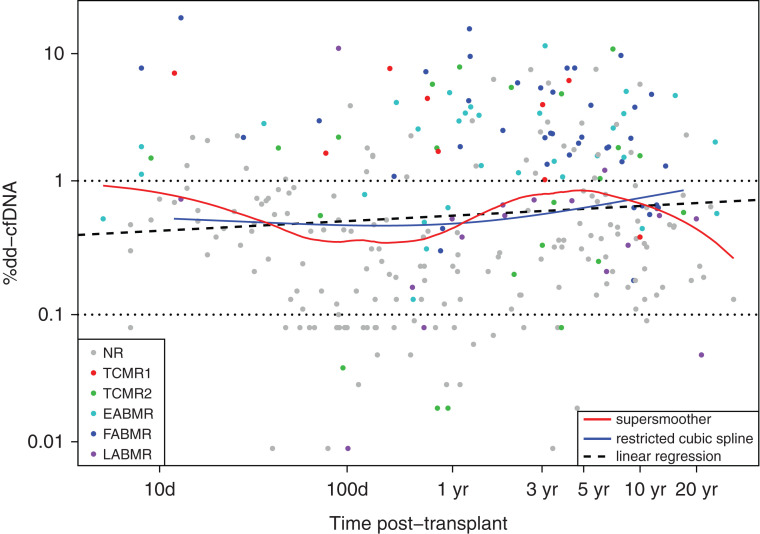
Figure 2.
Relationships between %dd-cfDNA, time of biopsy post-transplant, and molecular archetype groups in N=300 samples. Dots represent biopsies and corresponding paired blood sample %dd-cfDNA results, colored by archetype cluster assignments. Relationships between %dd-cfDNA and time post-transplant are represented by linear regression (thick dashed black line), restricted cubic spline (with three knots - blue line) and a supersmoother (red line). Overall, %dd-cfDNA increases slightly over time post-transplant (linear regression P=0.06). %dd-cfDNA ≥ 1 is used as the cutoff throughout this paper for positivity. NR – no rejection.

