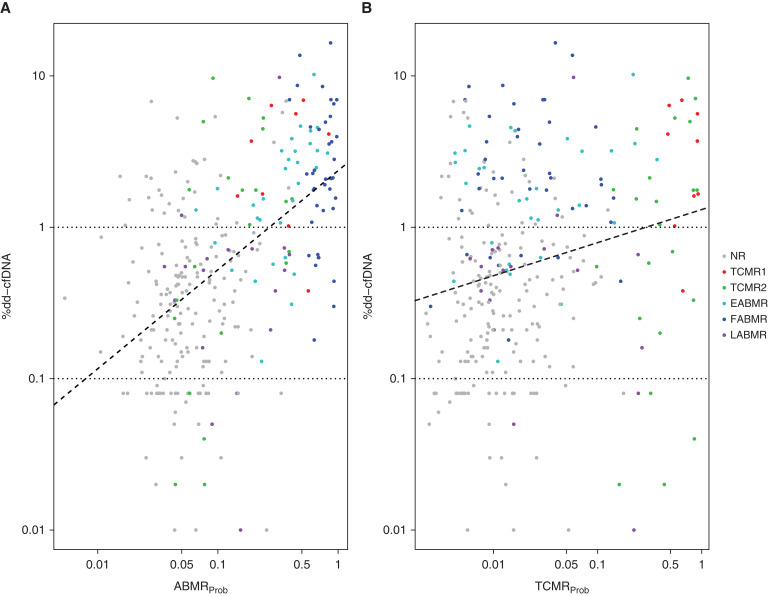
Figure 3.
Relationships between %dd-cfDNA, molecular archetype groups, and the ABMRProb and TCMRProb classifier scores in N=300 samples. Dots represent biopsies and corresponding paired blood sample %dd-cfDNA results, colored by archetype cluster assignments. Regression lines (dashed) show the relationship between the (A) ABMRProb and (B) TCMRProb classifier scores and %dd-cfDNA. Spearman correlations with dd-cfDNA were stronger for ABMRProb (0.52, P=6E-22) than TCMRProb (0.22, P=9E-5). NR, no rejection.

