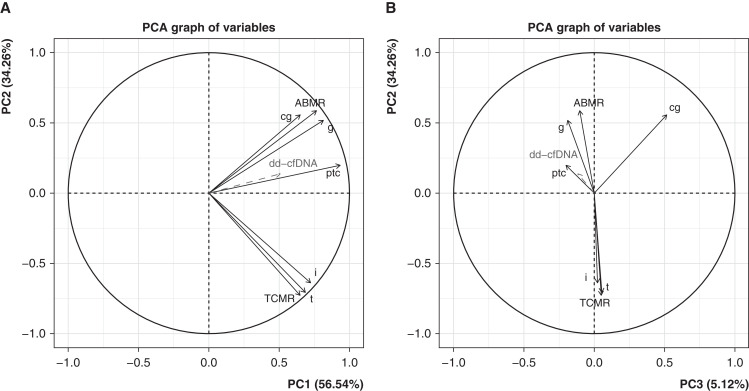
Figure 4.
Rejection classifier PCA factor maps in N=300 samples, showing %dd-cfDNA as a supplementary variable. (A) PC2 versus PC1. (B) PC2 versus PC3. Input variables (classifier scores) are shown as solid black lines, and %dd-cfDNA in dashed grey as it is not included as input in the PCA. %dd-cfDNA behaves like a molecular rejection measurement, more closely aligned to ABMR than to TCMR.

