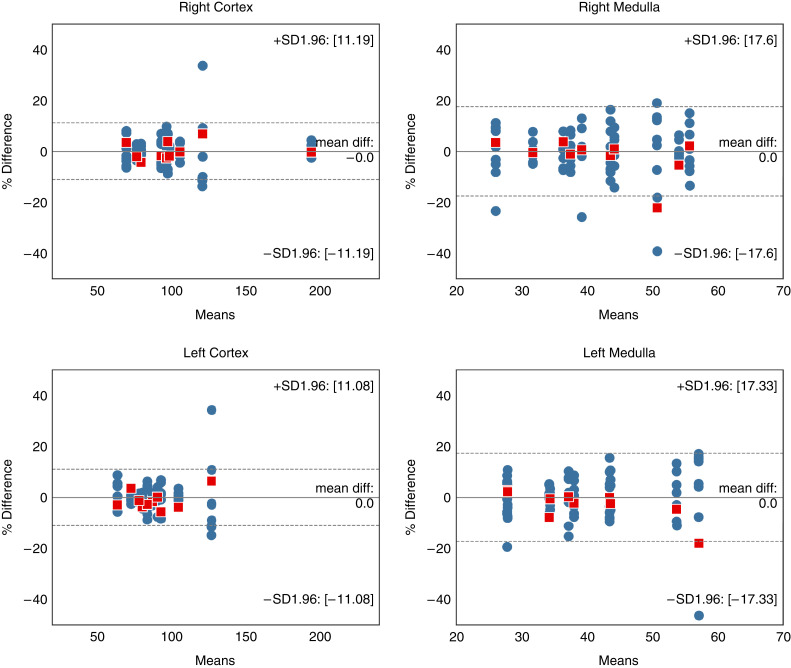
Figure 5.
Bland–Altman analysis of nine readers (blue circles) and the automated method (red squares) compared with the reference standard (mean of nine readers) for all four regions. Mean volumes along the x-axis are represented in cubic centimeters. The solid line represents the actual mean difference (bias), and the dotted lines show 95% LoAs. Both are calculated from the nine readers.

