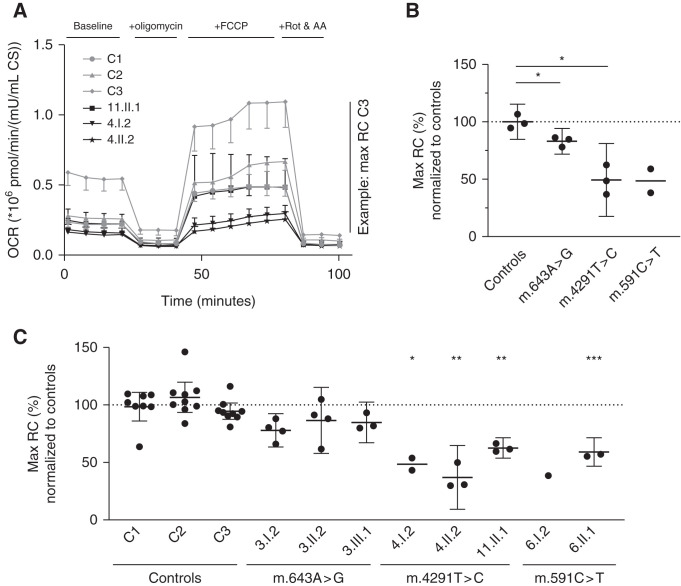
Figure 5.
Mitochondrial maximal respiratory capacity is reduced in patient fibroblasts. Mitochondrial function assessed by the Seahorse XFe96 analyzer. (A) Representative OCR plot of a Mito Stress Test of fibroblasts from three patients with the m.4291T>C variant and three controls (n=6 wells for each measurement point). Error bars denote + or − SD. (B) Average maximal mitochondrial respiration for the different mtDNA variants. Each point represents the average of all independent experiments for one individual (n=1–9, depending on the individual, as can be seen in panel [C]). (C) Average maximal mitochondrial respiration for each individual. Each point represents the average of all replicate wells on one Seahorse plate (n=6). (B and C) Means are represented by horizontal bars, error bars denote the 95% confidence interval, and a one-way ANOVA with Dunnett T3 was used to calculate significance. OCR is in pmol O2/min per mU/ml citrate synthase. AA, antimycin A; CS, citrate synthase activity; FCCP, carbonyl cyanide 4‐(trifluoromethoxy)phenylhydrazone; RC, respiratory capacity; Rot, rotenone. *P<0.05; **P<0.005; ***P<0.0005.

