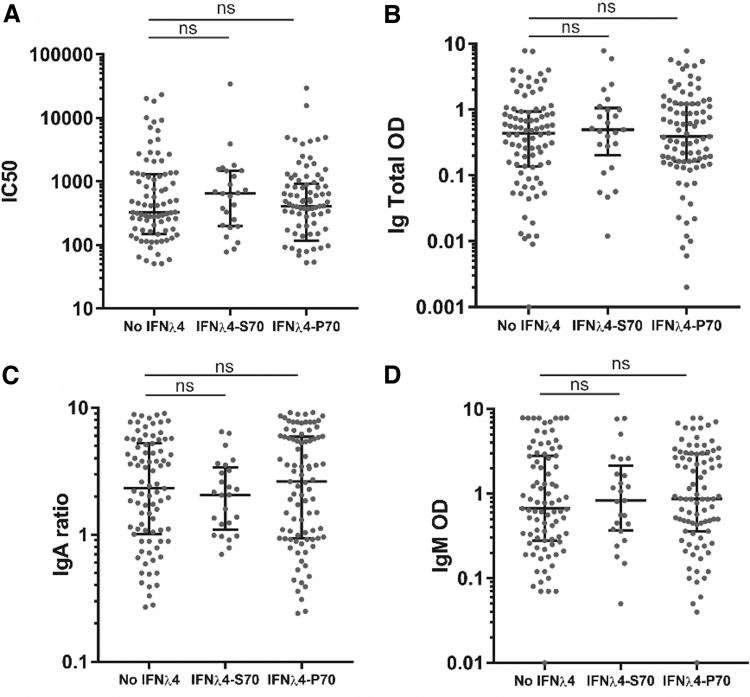
FIG. 2.
Antibody response toward the SARS-CoV-2 spike assigned to the IFNλ4 haplotype. (A) IC50 values calculated from neutralization curves. (B) Blank-corrected chemiluminescent signal of total Ig against SARS-CoV-2 spike measured by ELISA. Total Ig is shown as OD (1:100). (C) Blank-corrected chemiluminescent signal of IgA against SARS-CoV-2 spike measured by ELISA. IgA is shown as ratio against standard. (D) Blank-corrected chemiluminescent signal of IgM against SARS-CoV-2 spike measured by ELISA. IgM is shown as OD (1:11). Error bars show median and interquartile range. Statistical comparison by Mann–Whitney U test. ns = P > 0.05, n = 201. Ig, immunoglobulin; SARS-CoV-2, severe acute respiratory syndrome coronavirus 2.

