
FIGURE 3.
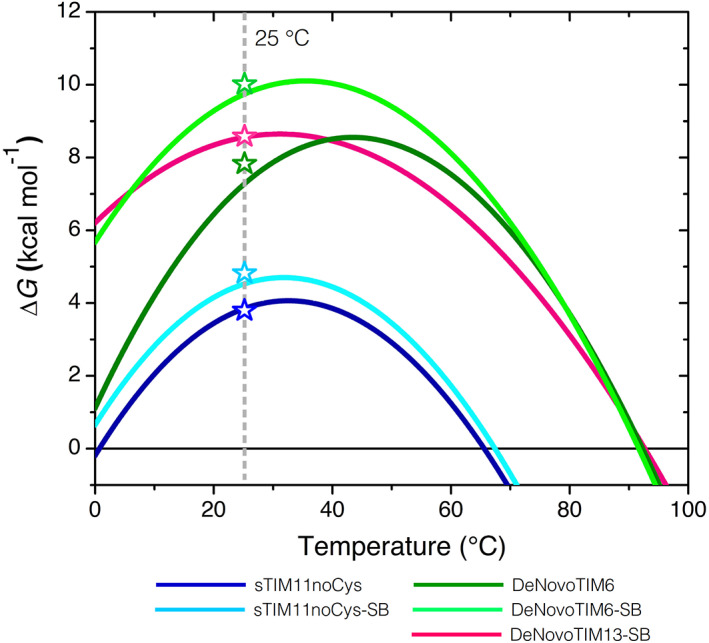
Stability curves of the salt bridge variants. Curves were constructed using the parameters from DSC experiments and the Gibbs–Helmholtz equation. Open symbols indicate the ΔG value at 25°C determined by chemical unfolding. Data from sTIM11noCys and DeNovoTIM6 are reported in Reference 27