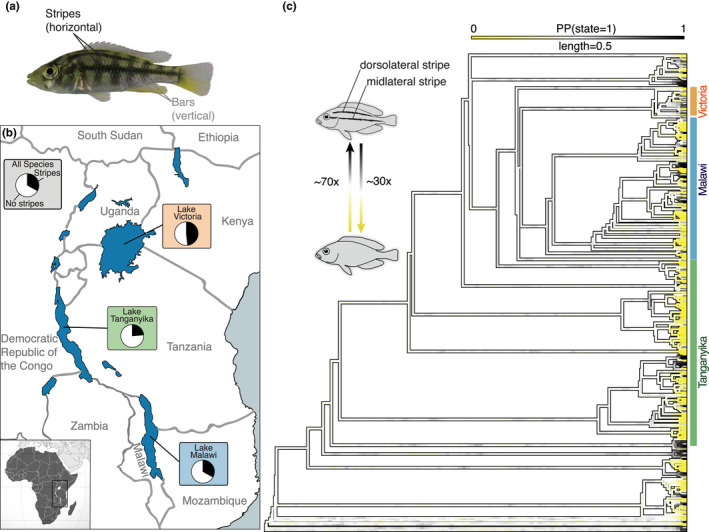
FIGURE 1.

Repeated evolution of horizontal stripes across East African cichlid radiations. (a) Picture of a female Haplochromis chilotes showing both stripe (black) and bar patterns (grey). (b) Map of East Africa highlighting Lakes Victoria, Tanganyika, and Malawi that encompass the three main radiations. Pie charts give the percentage of striped species (overall ~30%, in gray). The percentage of striped species was inferred from the presented data (461 species). Color codes show the major radiations of Lakes Tanganyika (green), Malawi (blue), and Victoria (orange). (c) Phylogenetic supertree of 461 East African cichlids with likelihood reconstructions of ancestral states (yellow–white–black gradient with yellow indicating a nonstriped state and black a striped state) of the stripe phenotype that evolved ~70 times independently. White branches moving away from the tips of the tree represent the inherent uncertainty in our ancestral state reconstructions
