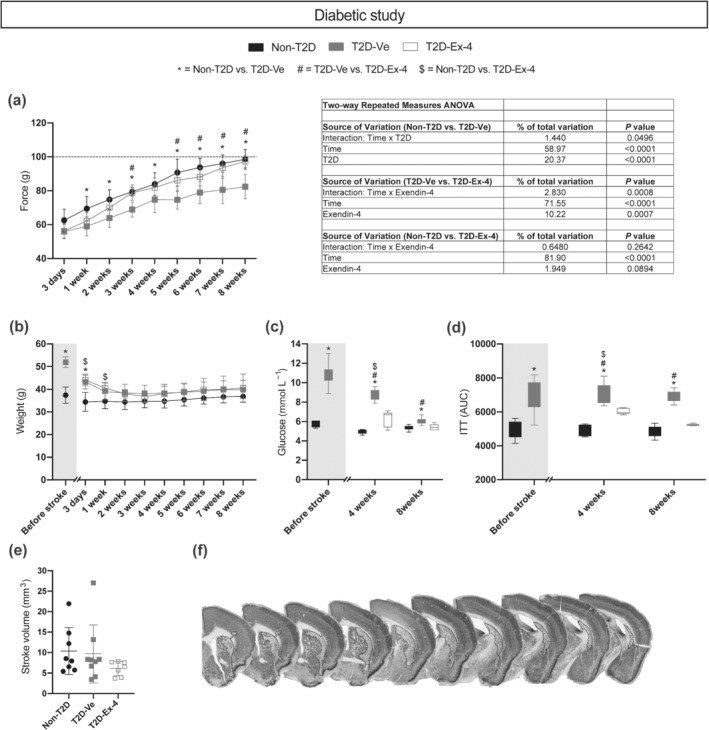
FIGURE 2.

The effect of T2D and exendin‐4 treatment on neurological recovery, metabolic parameters and ischaemic volume after tMCAO. (a) Grip strength recovery and ANOVA table. Dashed line in (a) indicates mean of pre‐stroke grip strength. (b) Body weight. (c) Fasting glucose. (d) Insulin sensitivity (insulin tolerance test, ITT). (e) Ischaemic volume. (f) Representative images of NeuN staining. The dotted lines on images on (f) panel indicate stroke area. Data in (a), (b) and (e) are presented as mean ± SD. Box plots on (c) and (d) show min–max values. Group sizes for (b)–(d): Non‐T2D n = 9, T2D‐Ve n = 9, T2D‐Ex‐4 n = 7. For (a), one statistical outlier was excluded from the T2D‐Ve group, resulting in the following group sizes: Non‐T2D n = 9, T2D‐Ve n = 8, T2D‐Ex‐4 n = 7. For (e), one statistical outlier was excluded from the non‐T2D group, resulting in the following group sizes: Non‐T2D n = 8, T2D‐Ve n = 9, T2D‐Ex‐4 n = 7. Two‐way repeated measures ANOVA with Geisser–Greenhouse's correction followed by Sidak's test was used to analyse grip strength, body weight, fasting glucose and insulin sensitivity (a–d). Kruskal–Wallis with uncorrected Dunn's test was used to analyse ischaemic volume (e). *, # P < 0.05, significantly different from T2D‐Ve; $ P < 0.05, Non‐T2D significantly different from T2D‐Ex‐4
