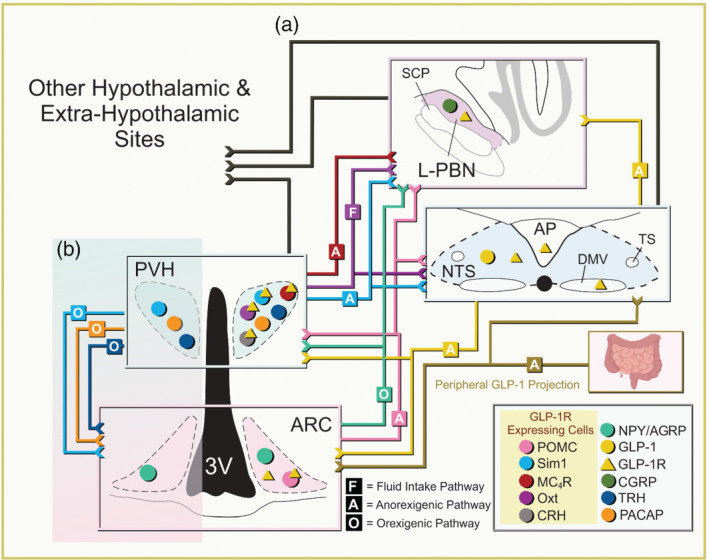
FIGURE 2.

(a) Four nuclei are shown here: arcuate nucleus (ARC), lateral parabrachial nucleus neurons (L‐PBN), paraventricular hypothalamic nucleus (PVH) and nucleus tractus solitarius (NTS). Each neuronal structure has input and output projections represented by a coloured line. Each colour represents a specific cell population, that is, pro‐opiomelanocortin (POMC) is pink and projects from the ARC to the L‐PBN, nucleus tractus solitarius (NT)S and PVH. The coloured lines represent cell‐specific projections to different brain structures. Projections to a specific region are cell‐type dependent projections to that region and not to a specific cell type in that region. Projections are labelled with either F, A or O—fluid intake, anorexigenic or orexigenic pathways, respectively. Cell populations expressing GLP‐1 receptor (R)s are highlighted within a yellow box in the figure legend at the bottom right as well as with a yellow triangle on top of the GLP‐1 receptor expressing cells (coloured circle). Yellow triangles in any nuclei signify the presence of GLP‐1 receptors but not assigned to a specific cell type. Central GLP‐1 originates from the NTS (yellow) whereas peripheral GLP‐1 from the intestine (bottom right; yellow‐brown). The black arrows represent non‐cell‐type specific projections from the NTS, PVH and L‐PBN to other hypothalamic and extra‐hypothalamic sites. (b) The highlighted region focuses on the PVH single‐minded 1 (Sim1)+, pituitary adenylate‐cyclase‐activating polypeptide (PACAP)+, thyrotropin releasing hormone (TRH)+ to ARC agouti‐related protein(AGRP) orexigenic pathway (Krashes et al., 2014). Positions of cells do not represent hemispheric segregation nor exact location. Abbreviation: SCP, superior cerebellar peduncle
