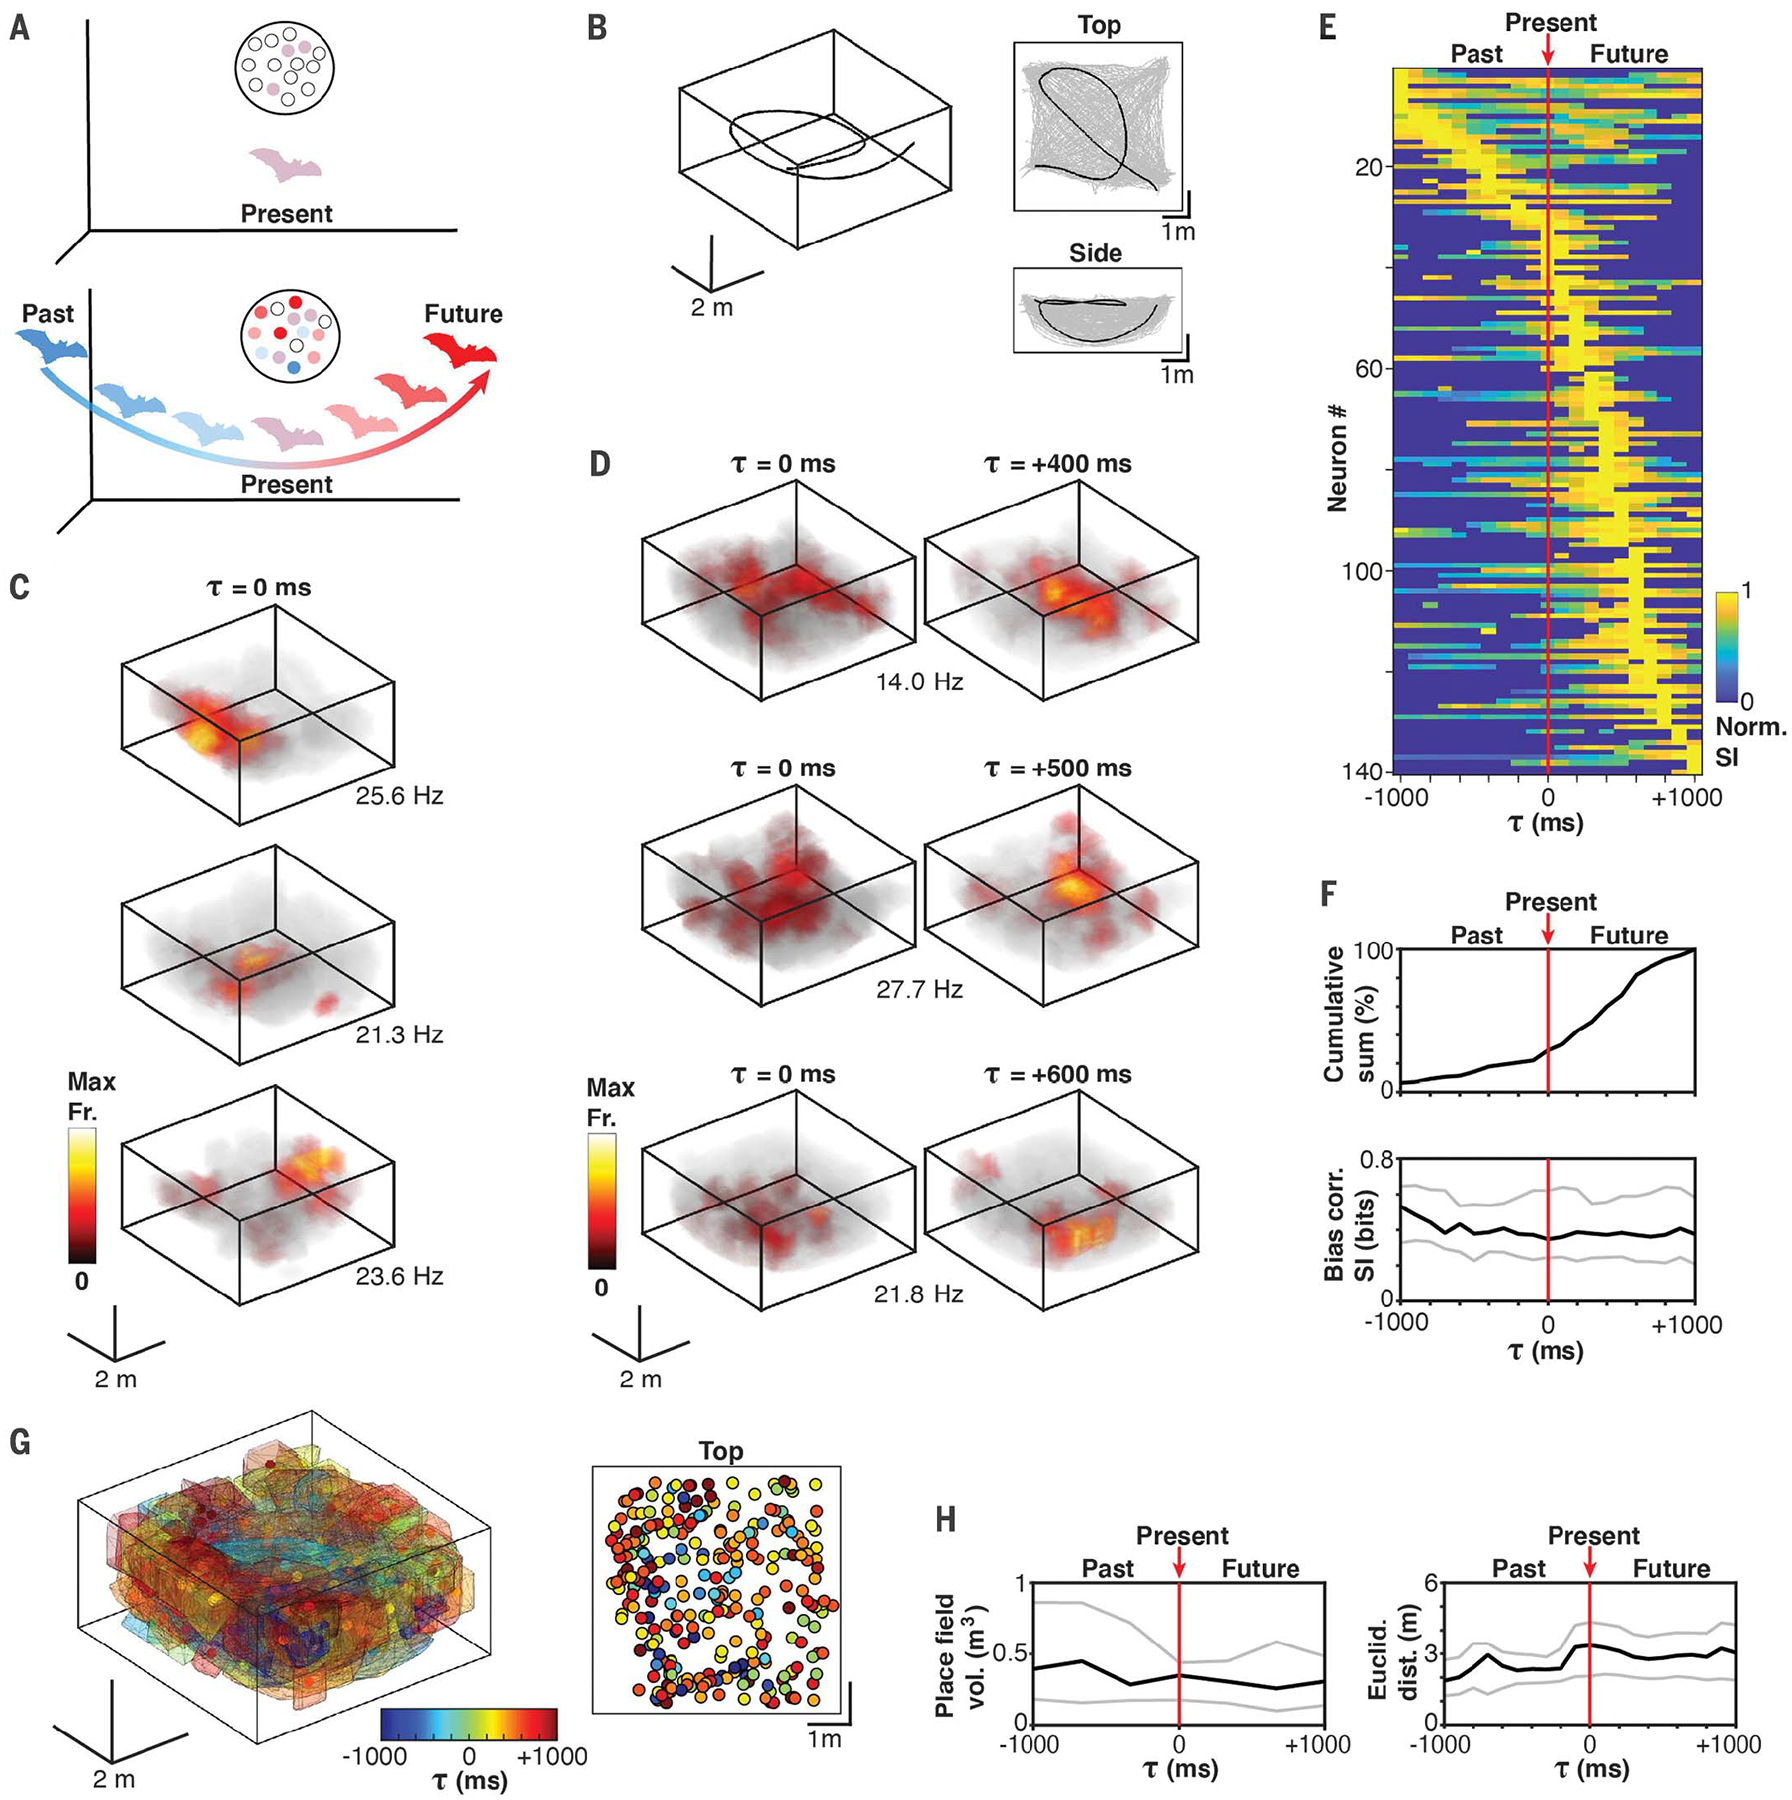
Fig. 1. CA1 neurons in flying bats encode nonlocal positions, primarily in the future.

(A) Illustration of nonlocal coding hypothesis. Top: A subset of classical place cells (light purple circles) with place fields overlapping with the immediate spatial position (local). Bottom: Neurons with nonlocal fields encoding past (blue) and future (red) spatial positions. (B) Example of a single flight (left) and the spatial coverage (gray lines) shown from the top and the side for an entire recording session. Black trace corresponds to the example flight trajectory. (C) 3D color-coded firing rate maps for three examples of 3D place cells. Bias-corrected spatial information values for the three cells is as follows: top, 0.81 bits; middle, 0.61 bits; and bottom, 0.61 bits. The peak firing rate is indicated. (D) Same as (C) but for three example neurons exhibiting higher 3D spatial information for future positions. Spatial information values for the example neurons are as follows: top, lag zero = 0.10 bits [not significant (n.s.)] and optimal lag = 0.28 bits; middle: lag zero = 0.11 bits (n.s) and optimal lag = 0.30 bits; and bottom, lag zero = 0.18 bits (n.s.) and optimal lag = 0.58 bits. (E) Normalized spatial information across time lags for each neuron with significant spatial information at one or more time lags (−1000 to 1000 ms in 100-ms steps). Rank order is based on the time lag with maximal spatial information. (F) Cumulative sum of the time lags with maximal spatial information for each neuron (top) and summary of the bias-corrected spatial information values at each lag (one value per neuron) (bottom). The 25th (bottom gray line), 50th (middle black line), and 75th (top gray line) percentiles are shown. (G) Left: Convex hull representation of all significant spatiotemporal field locations across all recorded neurons. Right: top-down view showing location of spatiotemporal field centers. Color code indicates the time lag of maximal spatial information. (H) Field volume across lags (left) and Euclidean distance between all field centers at each lag (right). The 25th (bottom gray line), 50th (middle black line), and 75th (top gray line) percentiles are shown.
