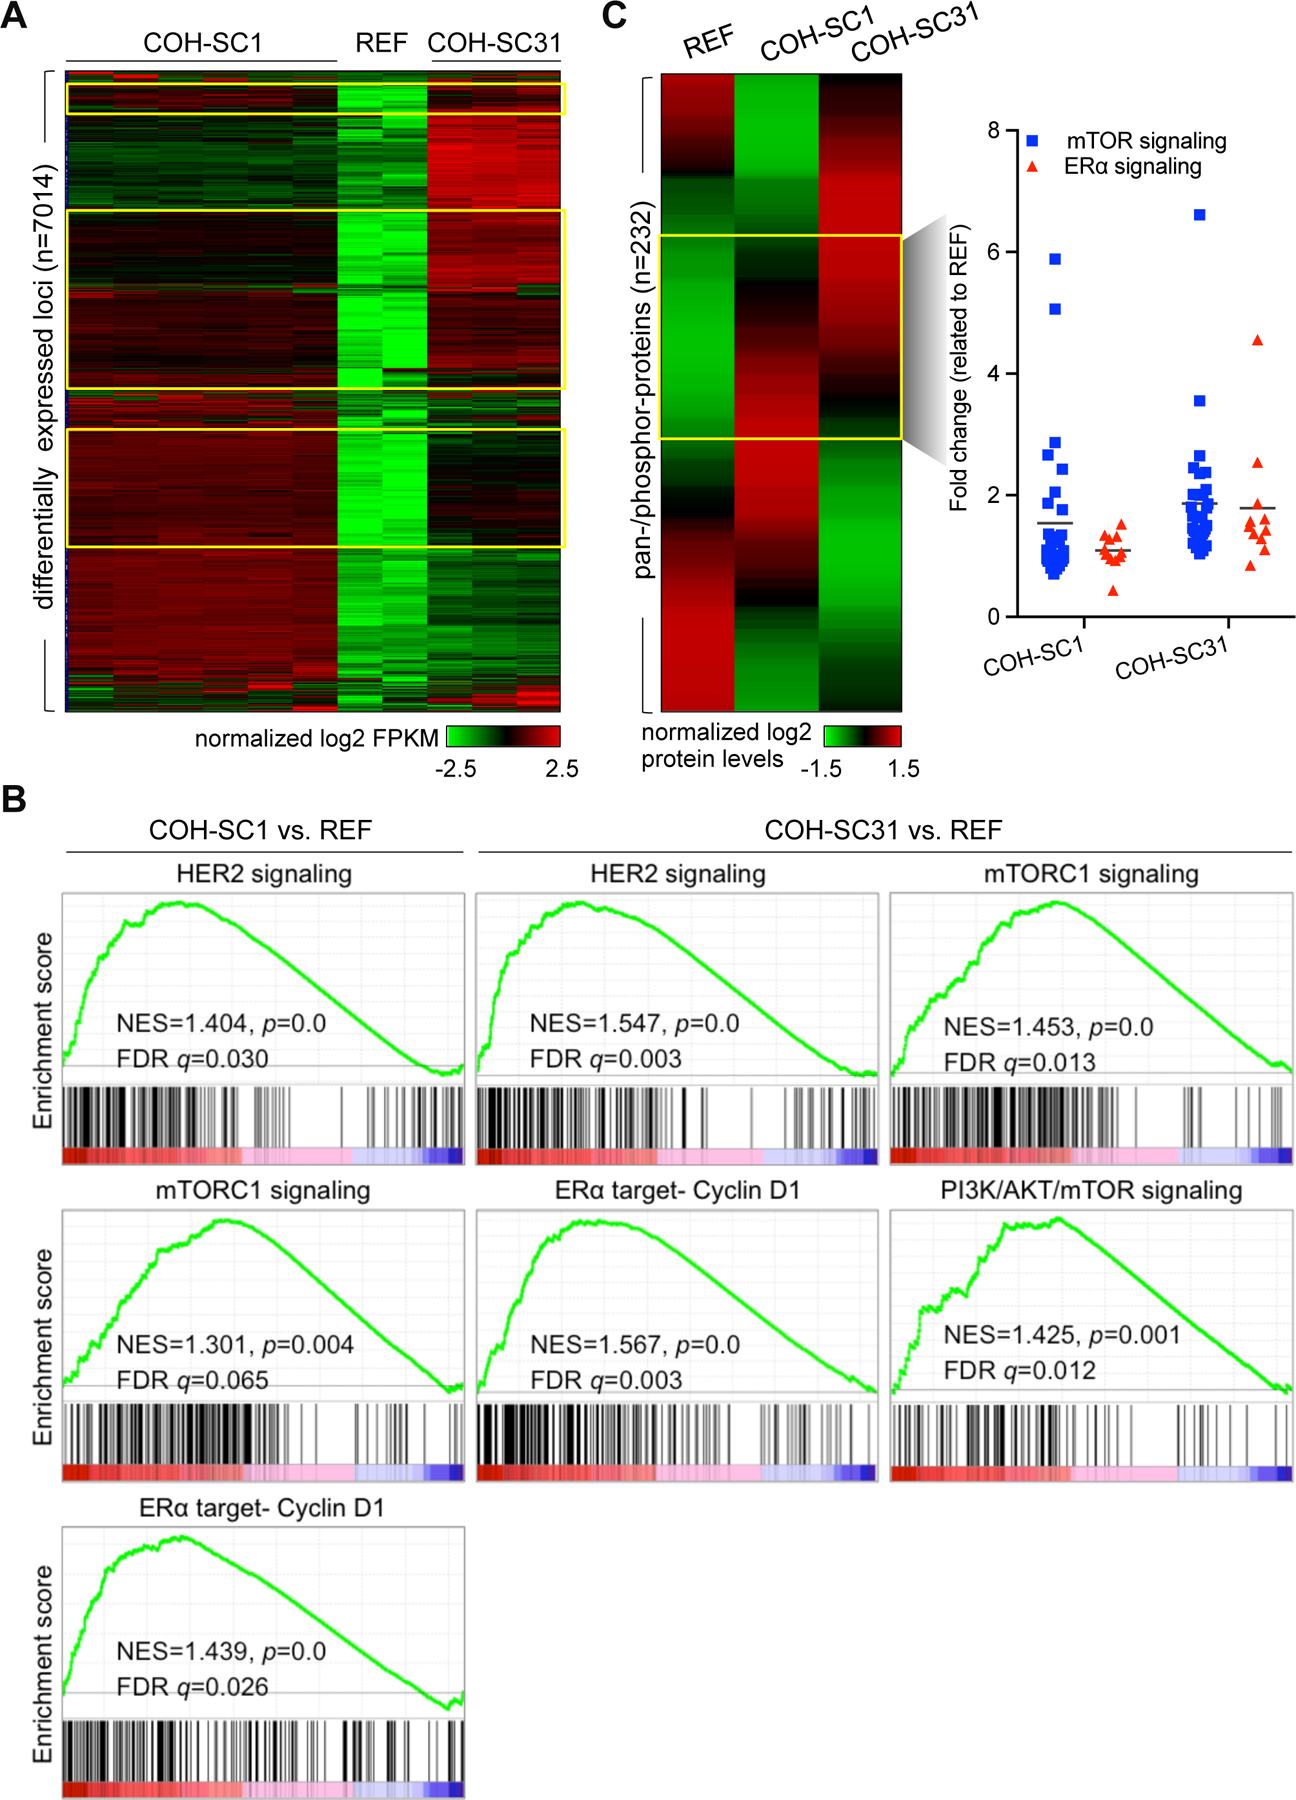
Figure 3. Deciphering molecular features of HR+/HER2+ PDXs.

(A) Transcriptome analysis of six COH-SC1 and three COH-SC31 tumors and two samples from the reference ER+/HER2− PDX (named as REF) using RNA-seq. A heat map was plotted to illustrate 7014 differentially expressed loci (p<0.05) in either COH-SC1 or COH-SC31 transcriptome in relation to the REF PDX. Yellow boxes, 549 common up-regulated loci in the two examined PDXs compared to the REF transcriptome. Intensity bar, normalized log2 FPKM (fragments per kilobase per million reads) value. (B) Gene set enrichment analysis (GSEA) of differentially expressed loci between COH-SC1 or COH-SC31 and the REF transcriptomes. HER2, mTOR signaling, and ERα target, Cyclin D1, were significantly and positively enriched in COH-SC1 and COH-SC31 transcriptomes. NES, normalized enrichment score. See also Supplementary Figure 4 for another systems-level pathway analysis using IPA. (C) Proteome analysis of COH-SC1 and COH-SC31 tumors using RPPA. A heat map was plotted to illustrate 232 pan-/phosphor-protein signatures in COH-SC1, COH-SC31, and the reference ER+/HER2− PDXs (left panel). Compared to the reference dataset (REF), pan-/phosphor-proteins participated in PI3K/AKT/mTOR and ERα signaling axis were relatively activated in both two PDXs as shown in yellow box and summarized in a scatter plot (right panel). Intensity bar, normalized log2 value. See also Supplementary Figure 5 for the expression levels of individual pan-/phosphor-proteins involved in HER2/ER and PI3K/AKT/mTOR signaling and the experimental validation of AKT and ER phosphorylation status using Western blot analysis.
