
Figure 4. Dissection of intrinsic subtypes and clinical relevance in COH-SC1 and COH-SC31.
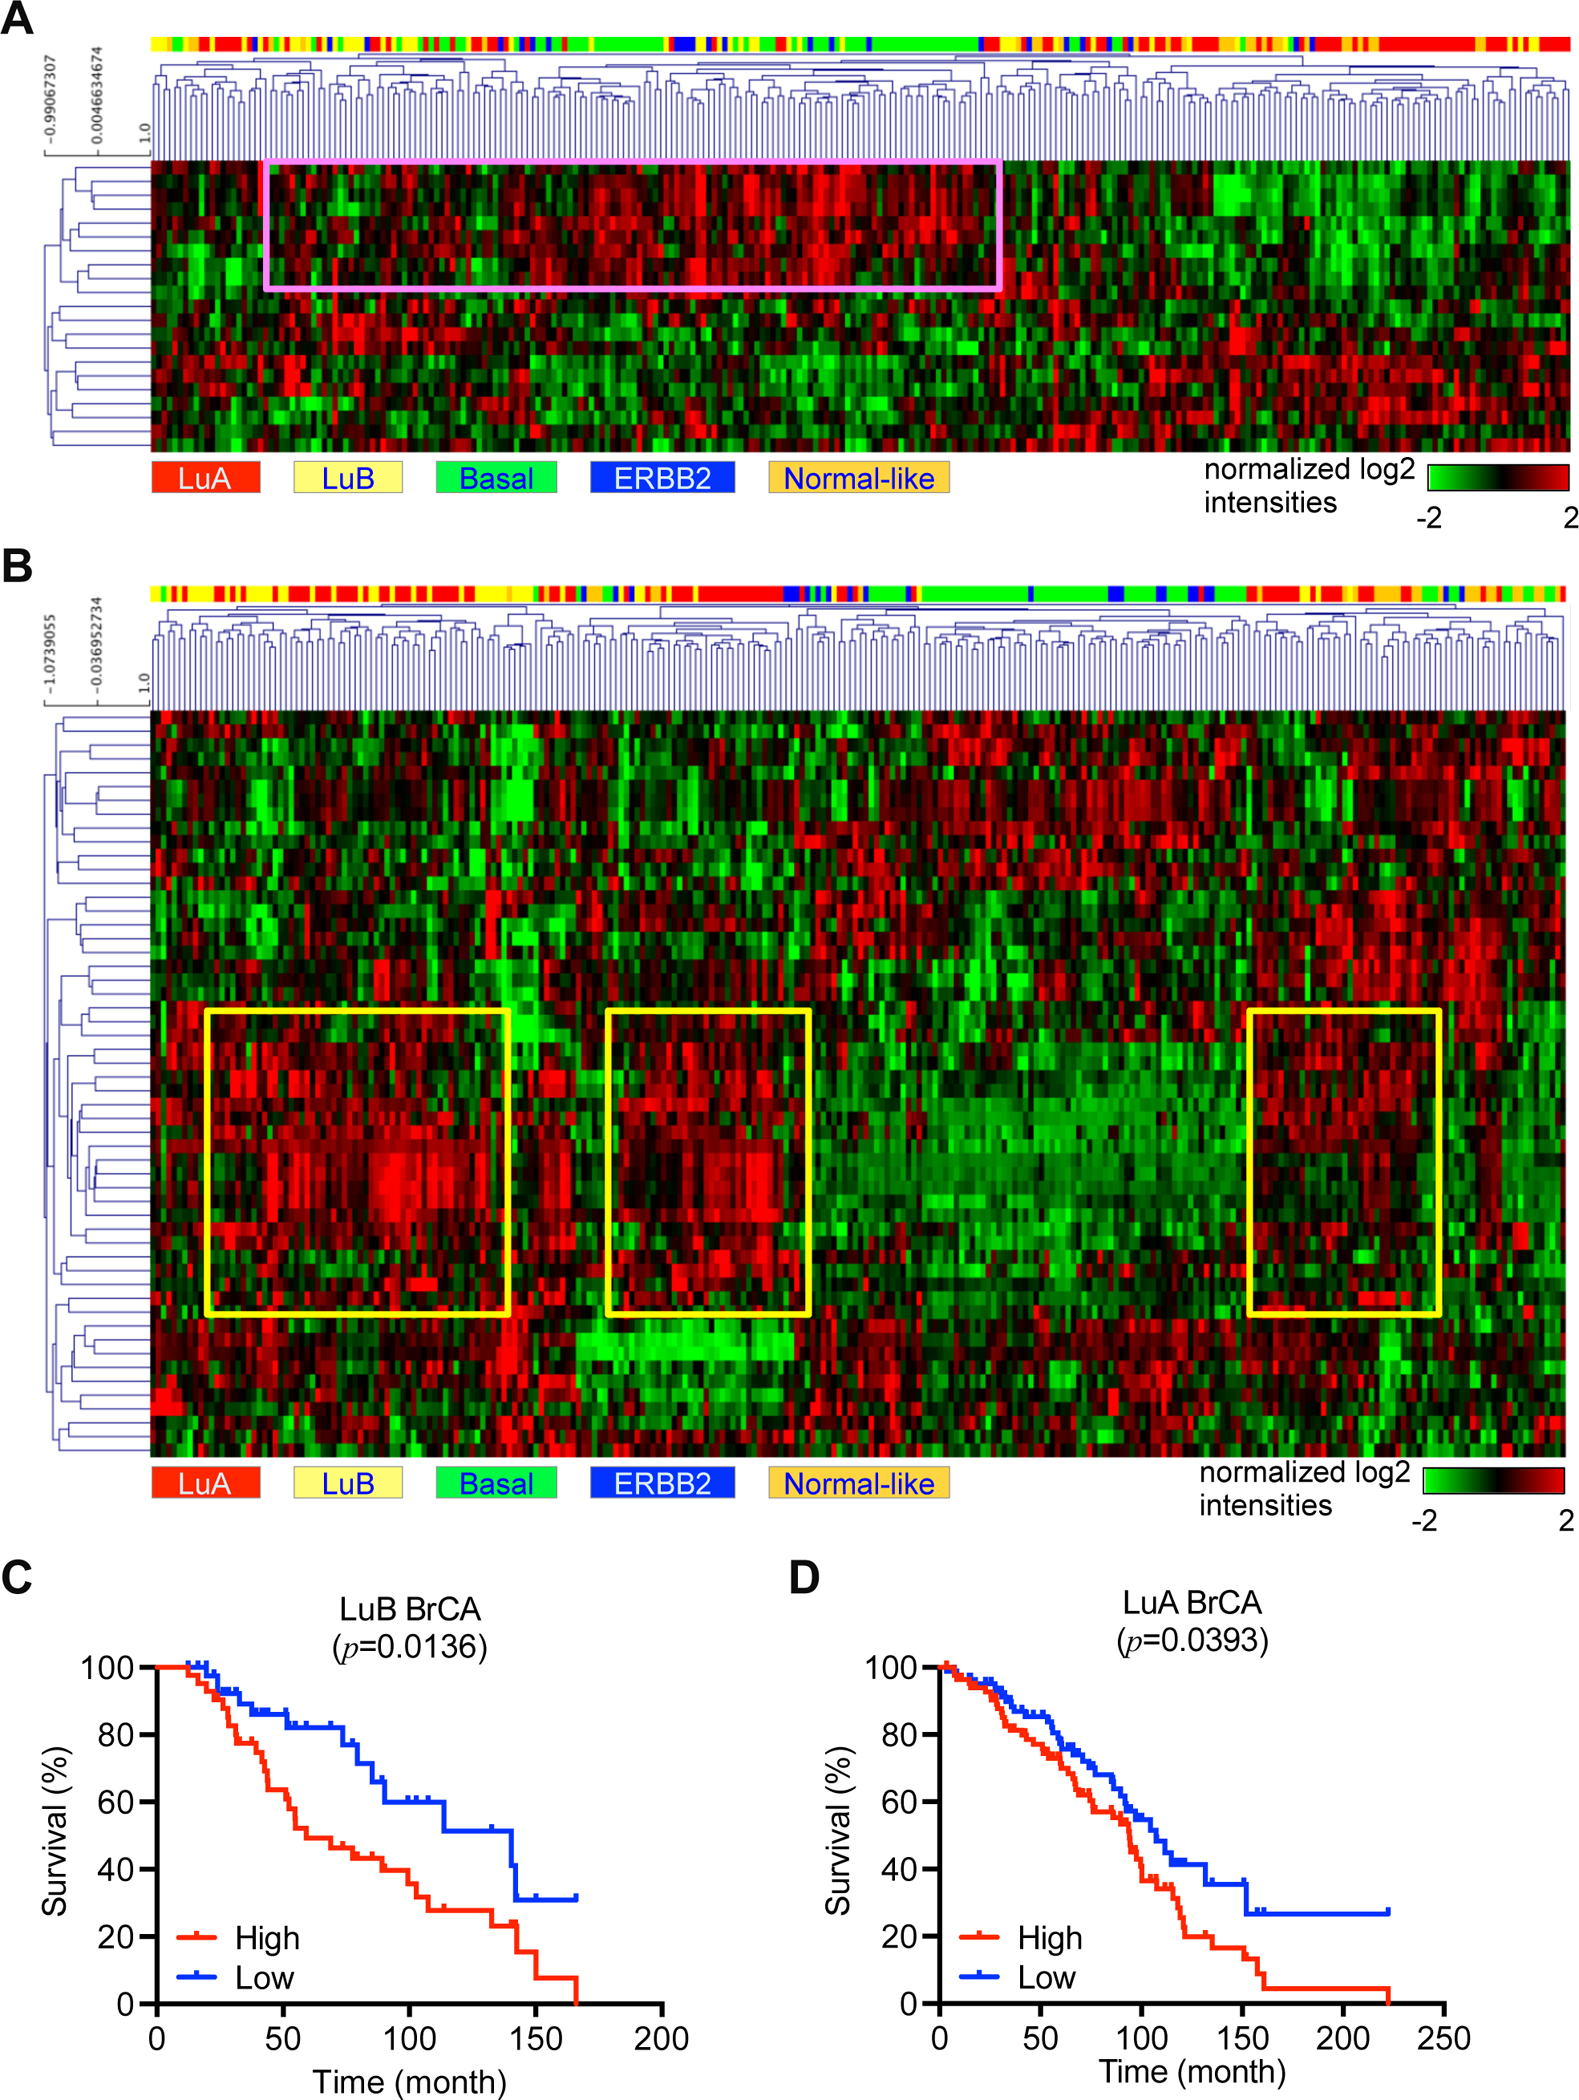
In silico analysis of the activated genes in COH-SC1 or COH-SC31 transcriptomes as aforementioned in Figure 3A in a breast cancer cohort harboring 266 samples within PAM50-classified subtype information was illustrated as heat maps with hierarchical clustering (28). Rows, activated genes; Columns, patient samples. (A) COH-SC1 was associated with luminal-B/basal breast cancers. Pink box, nine mTOR signaling-associated loci. (B) COH-SC31 was linked to luminal-A breast cancers. Yellow boxes, twenty-one mTOR and/or estrogen/ERα pathway-related loci. Kaplan-Meier analysis of luminal-B (C) or luminal-A (D) cancer patients within expression of the boxed genes identified in COH-SC1 (A) or COH-SC31 (B) models, respectively. Log-rank test was used to determine statistical significance.