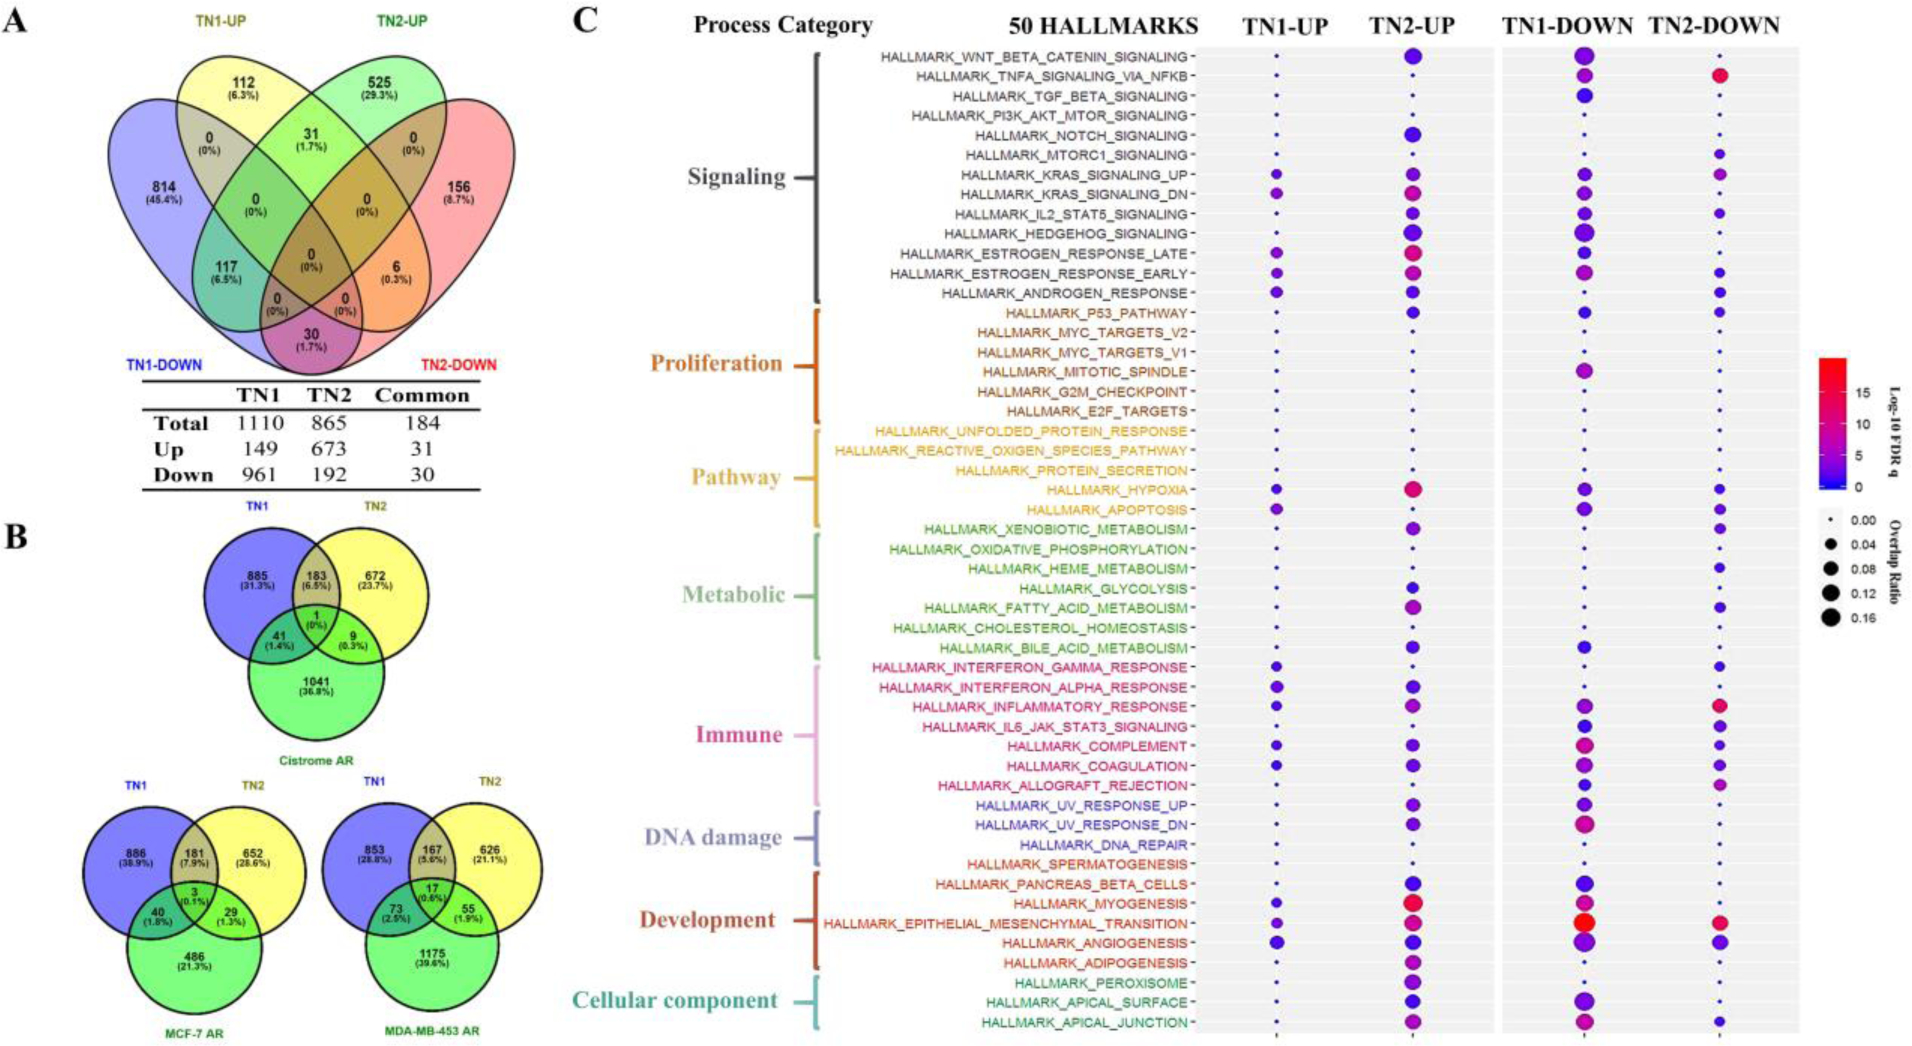
Figure 3. Functional characterization of transcriptional profiles induced by DHT in PDX tumors of TN1 and TN2.

A) Venn’s four-set diagram displayed the number of overlapping and unique genes sets in TN1 and TN2 after DHT treatment. TN1-UP/TN2-UP represented number of up-regulated genes in TN1/TN2-DHTs versus TH1/TH2-Ctrls and vice versa; B) Venn’s three-set diagram displayed the number of overlapping and unique AR responsive genes sets in TN1 and TN2 versus three AR responsive gene sets (Cistrome AR, MCF-7 AR and MDA-MB-453 AR); C) Distribution of GSEA enriched Hallmarks in TN1 (up versus down) and TN2 (up versus down). The size of spot indicated K/K value (overlap ratio) and the color of spot indicated significance by log-10 FDR q value (log-10 FDR q value>1.3, FDR q value<0.05 is the cutoff value for significance).
