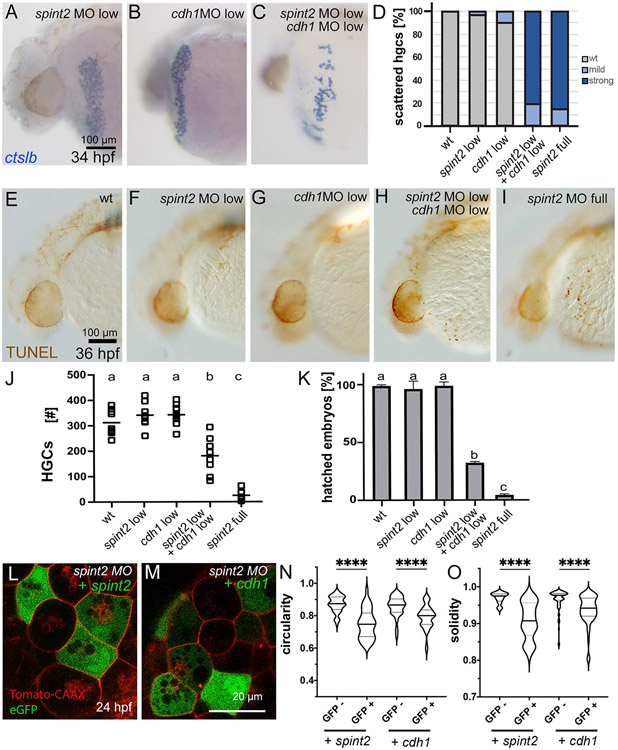
Figure 9: spint2 and cdh1 genetically interact to promote hatching gland morphogenesis and hatching gland cell survival.
A-C. ctlsb WISH displays normal distribution of hatching gland cells in 34 hpf embryos injected with low amounts of spint2 MO (A) and low amounts of cdh1 MO (B), but a scattered hatching gland phenotype in embryos injected with both (C). Wild-type and full spint2 MO controls as used for quantification (D) are not shown, but compare with Figures 3H,I and 7E,F for 28 hpf. D. Quantification of the scattered hatching gland phenotype analyzed at 34 hpf; n=7-31. E-I. TUNEL staining of 36 hpf embryos shows no TUNEL-positive cells on yolk sac in wild type (E) and in embryos injected with low amounts of spint2 MO (F) or low amounts of cdh1 MO (G), but multiple in embryo injected with low amounts of both (H), and even more in full spint2 morphant (I). J. Quantification of hatching gland cell (HGC) numbers scored by ctslb WISH of 44 hpf embryos injected with different MOs. Squares represent individual embryos; significances were determined via a one-way ANOVA and Tukey’s post hoc test. Different letters indicate statistically significant differences (p < 0.0001). K. Quantification of percentages of embryos hatched after 3 dpf, injected with different MOs; N=3, n=25-94. Significances were determined via a one-way ANOVA and Tukey’s post hoc test. Different letters indicate statistically significant differences (p < 0.0001). L-O. Forced expression of spint2 or cdh1 restores polygonal shapes of spint2 morphant hatching gland cells. L,M. Confocal images of 24 hpf spint2 morphant embryos transgenic for Tg(bact:tdtomato-caax) with mosaic expression of eGFP together with spint2 (L) or cdh1 (M). N,O. Quantification of cell shapes as shown in panels L and M. Violin plots show that compared to regular spint2 morphant control hatching gland cells (GFP−), the circularity (N) as well as solidity (M) indices of spint2 morphant hatching gland cells expressing spint2 or cdh1 (GFP+) are decreased and more similar to wild-type values (compare with Figure 6N,O); N=5-8 embryos, n=38-82 cells; **** indicates p value < 0.0001 determined via one-way ANOVA and Tukey’s post hoc test.

