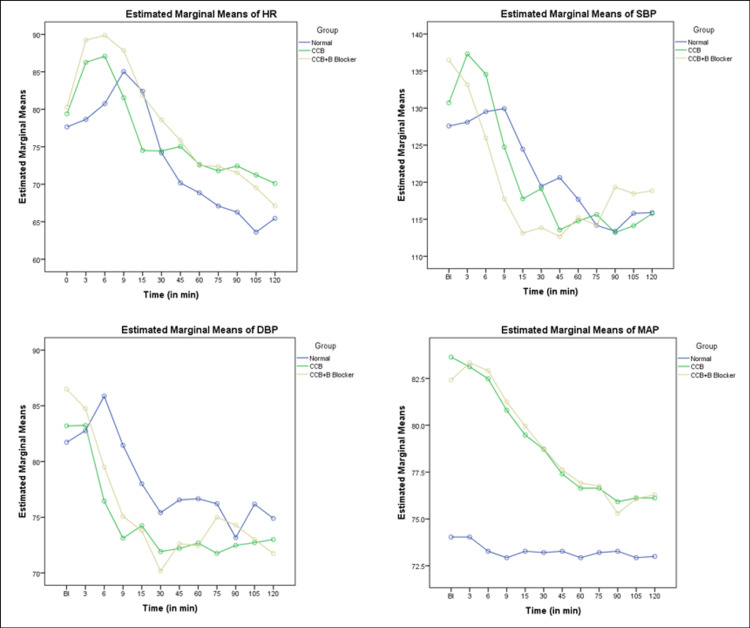
Figure 1. Estimated marginal means of different demographics (HR, SBP, DBP, and MAP).
The graphs are showing (A) change in HR over time, (B) change in SBP over time, (C) change in DBP over time, (D) and change in MAP over time.
SD: standard deviation; HR: heart rate; SBP: systolic blood pressure; DBP: diastolic blood pressure; MAP: mean arterial pressure; CCB: calcium channel blocker

