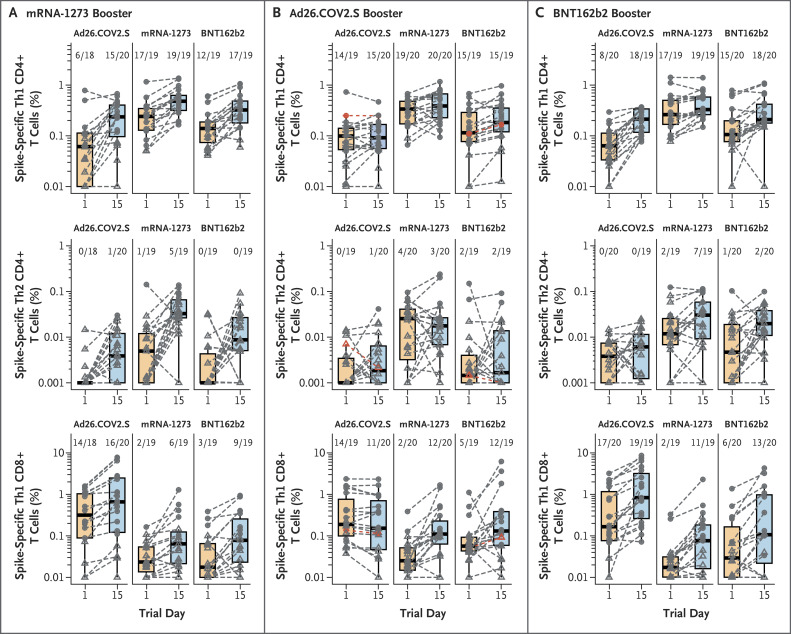
Figure 3. CD4+ and CD8+ T-Cell Responses.
Spike-specific T cells are shown in box plots before the administration of a homologous or heterologous booster vaccine on day 1 and after boosting on day 15. The boosters are shown at the top of each column, and the primary vaccines that each participant received are listed directly above each box plot. Circles indicate positive responses, and triangles indicate negative responses. Red symbols denote participants who had detectable antibody against the SARS-CoV-2 nucleocapsid protein at enrollment, indicative of previous SARS-CoV-2 infection. The responses are depicted as the background-subtracted percentage of spike-specific Th1 (interferon-γ, interleukin-2, or both) CD4+ T cells (top row), spike-specific Th2 (interleukin-4, interleukin-5, or interleukin-13) CD4+ T cells (middle row), and Th1 CD8+ T cells (bottom row). (Background subtraction refers to the subtraction of the values of the negative control sample from the peptide-stimulated sample.) The number of participants with a positive response among those tested is indicated as a fraction above each plot. Dashed lines link individual responses before and after the administration of the booster vaccine. The horizontal bar in each box indicates the median of all responses tested.

