Figure 3.

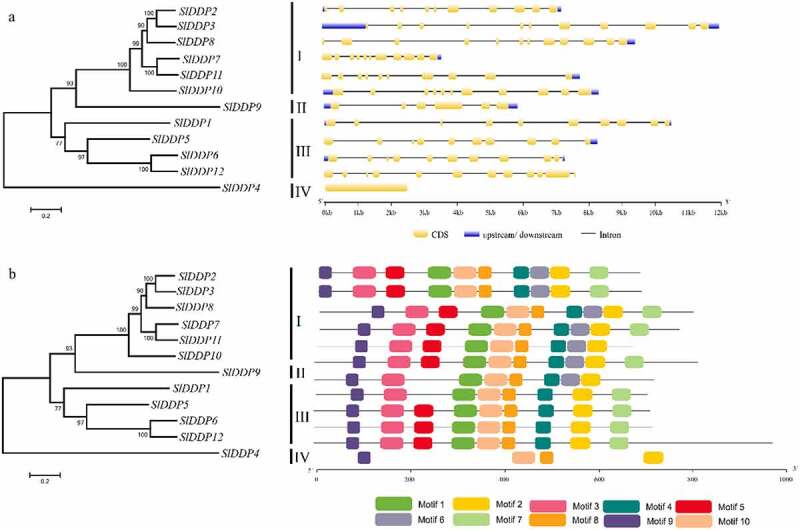
Gene structure analysis of tomato DDPs. (a) The number and distribution of exons and introns and (b) conserved motifs in SlDDPs identified using GSDS and MEME tools, respectively. The scale at the bottom is represented in Kb.

Gene structure analysis of tomato DDPs. (a) The number and distribution of exons and introns and (b) conserved motifs in SlDDPs identified using GSDS and MEME tools, respectively. The scale at the bottom is represented in Kb.