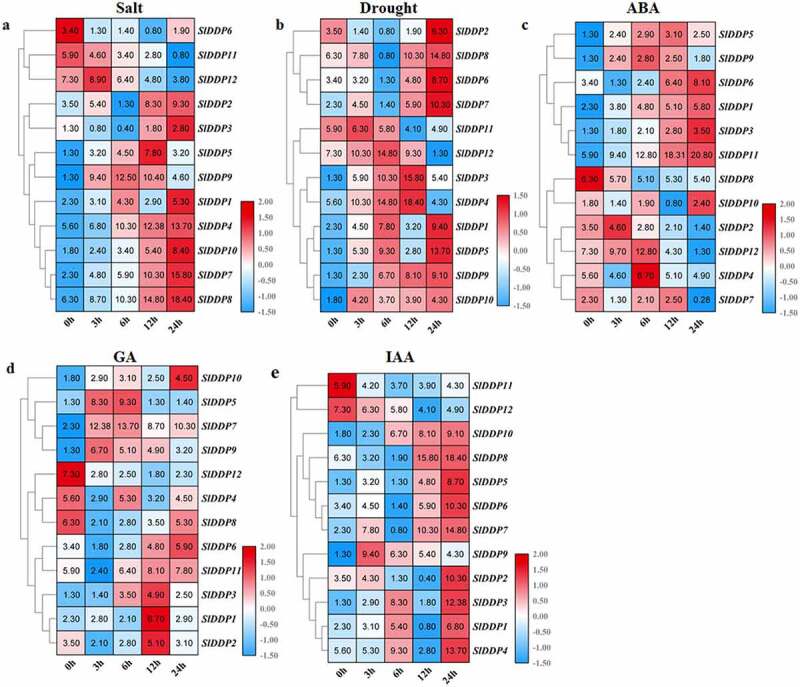
Figure 6.

Expression analysis of SLDDPs under salinity, drought, and Phytohormones. Heatmap showing expression profile of 12 SlDDPs under (a) salt, (b) drought (PEG), (c) Abscisic acid (ABA), (d) Gibberellin (GA3), and (e) Auxin (IAA) at 0 h, 3 h, 6 h, 12 h, and 24 h time points. Plants at 0 h time interval were used as control. Heatmap was generated using log2 transformed RT-qPCR values.
