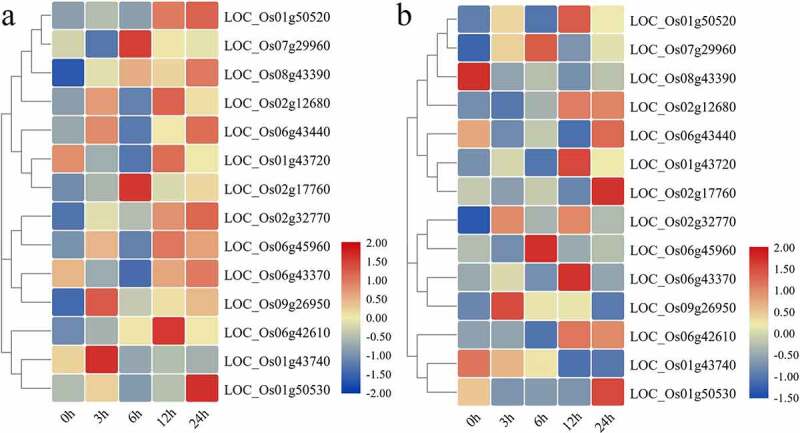
Figure 6.

Heatmap of expression patterns of 14 OsCYPs under (a) salinity (b) Drought stresses at 0 h, 3 h, 6 h, 12 h, and 24 h after treatment. All the values are log2 transformed. The expression was determined relative to expression at 0 h. The red and blue color is corresponding to high and low expressions.
