Figure 3.

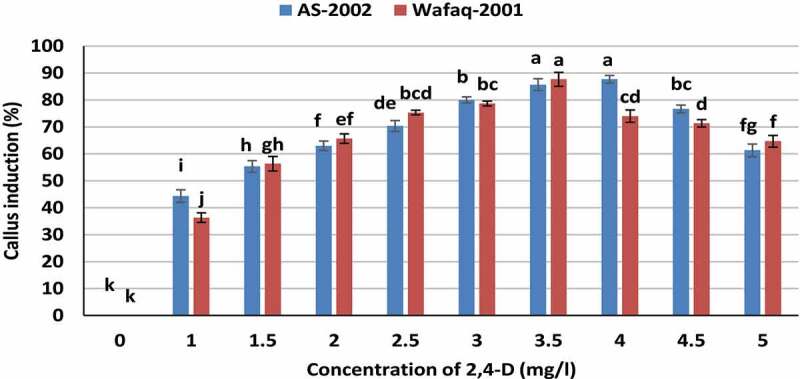
Callogenesis response of wheat genotypes to various induction medium. Bars sharing similar letters do not differ significantly (p < .05).

Callogenesis response of wheat genotypes to various induction medium. Bars sharing similar letters do not differ significantly (p < .05).