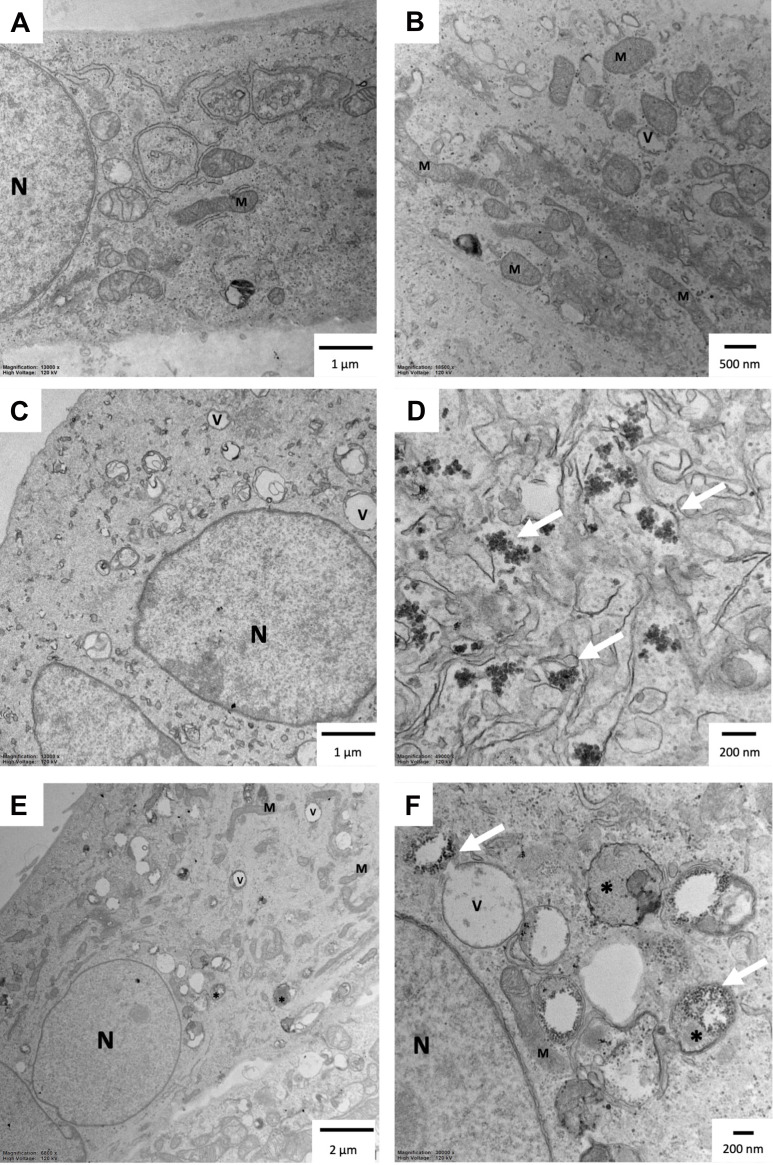
Figure 7.
Ultrastructure of the hFOB1.19 cells after 24 hours of incubation with AgNPs: (A and B) control cells; (C and D) cells treated with 1 µg/mL AgNPs-CHL; (E and F) cells treated with 1 µg/mL AgNPs-PEG-MET. Arrows indicate NPs. *Autophagic vacuoles; V–vacuoles; N – nucleus; M – mitochondria. The scale bar is present on the left side of each picture.

