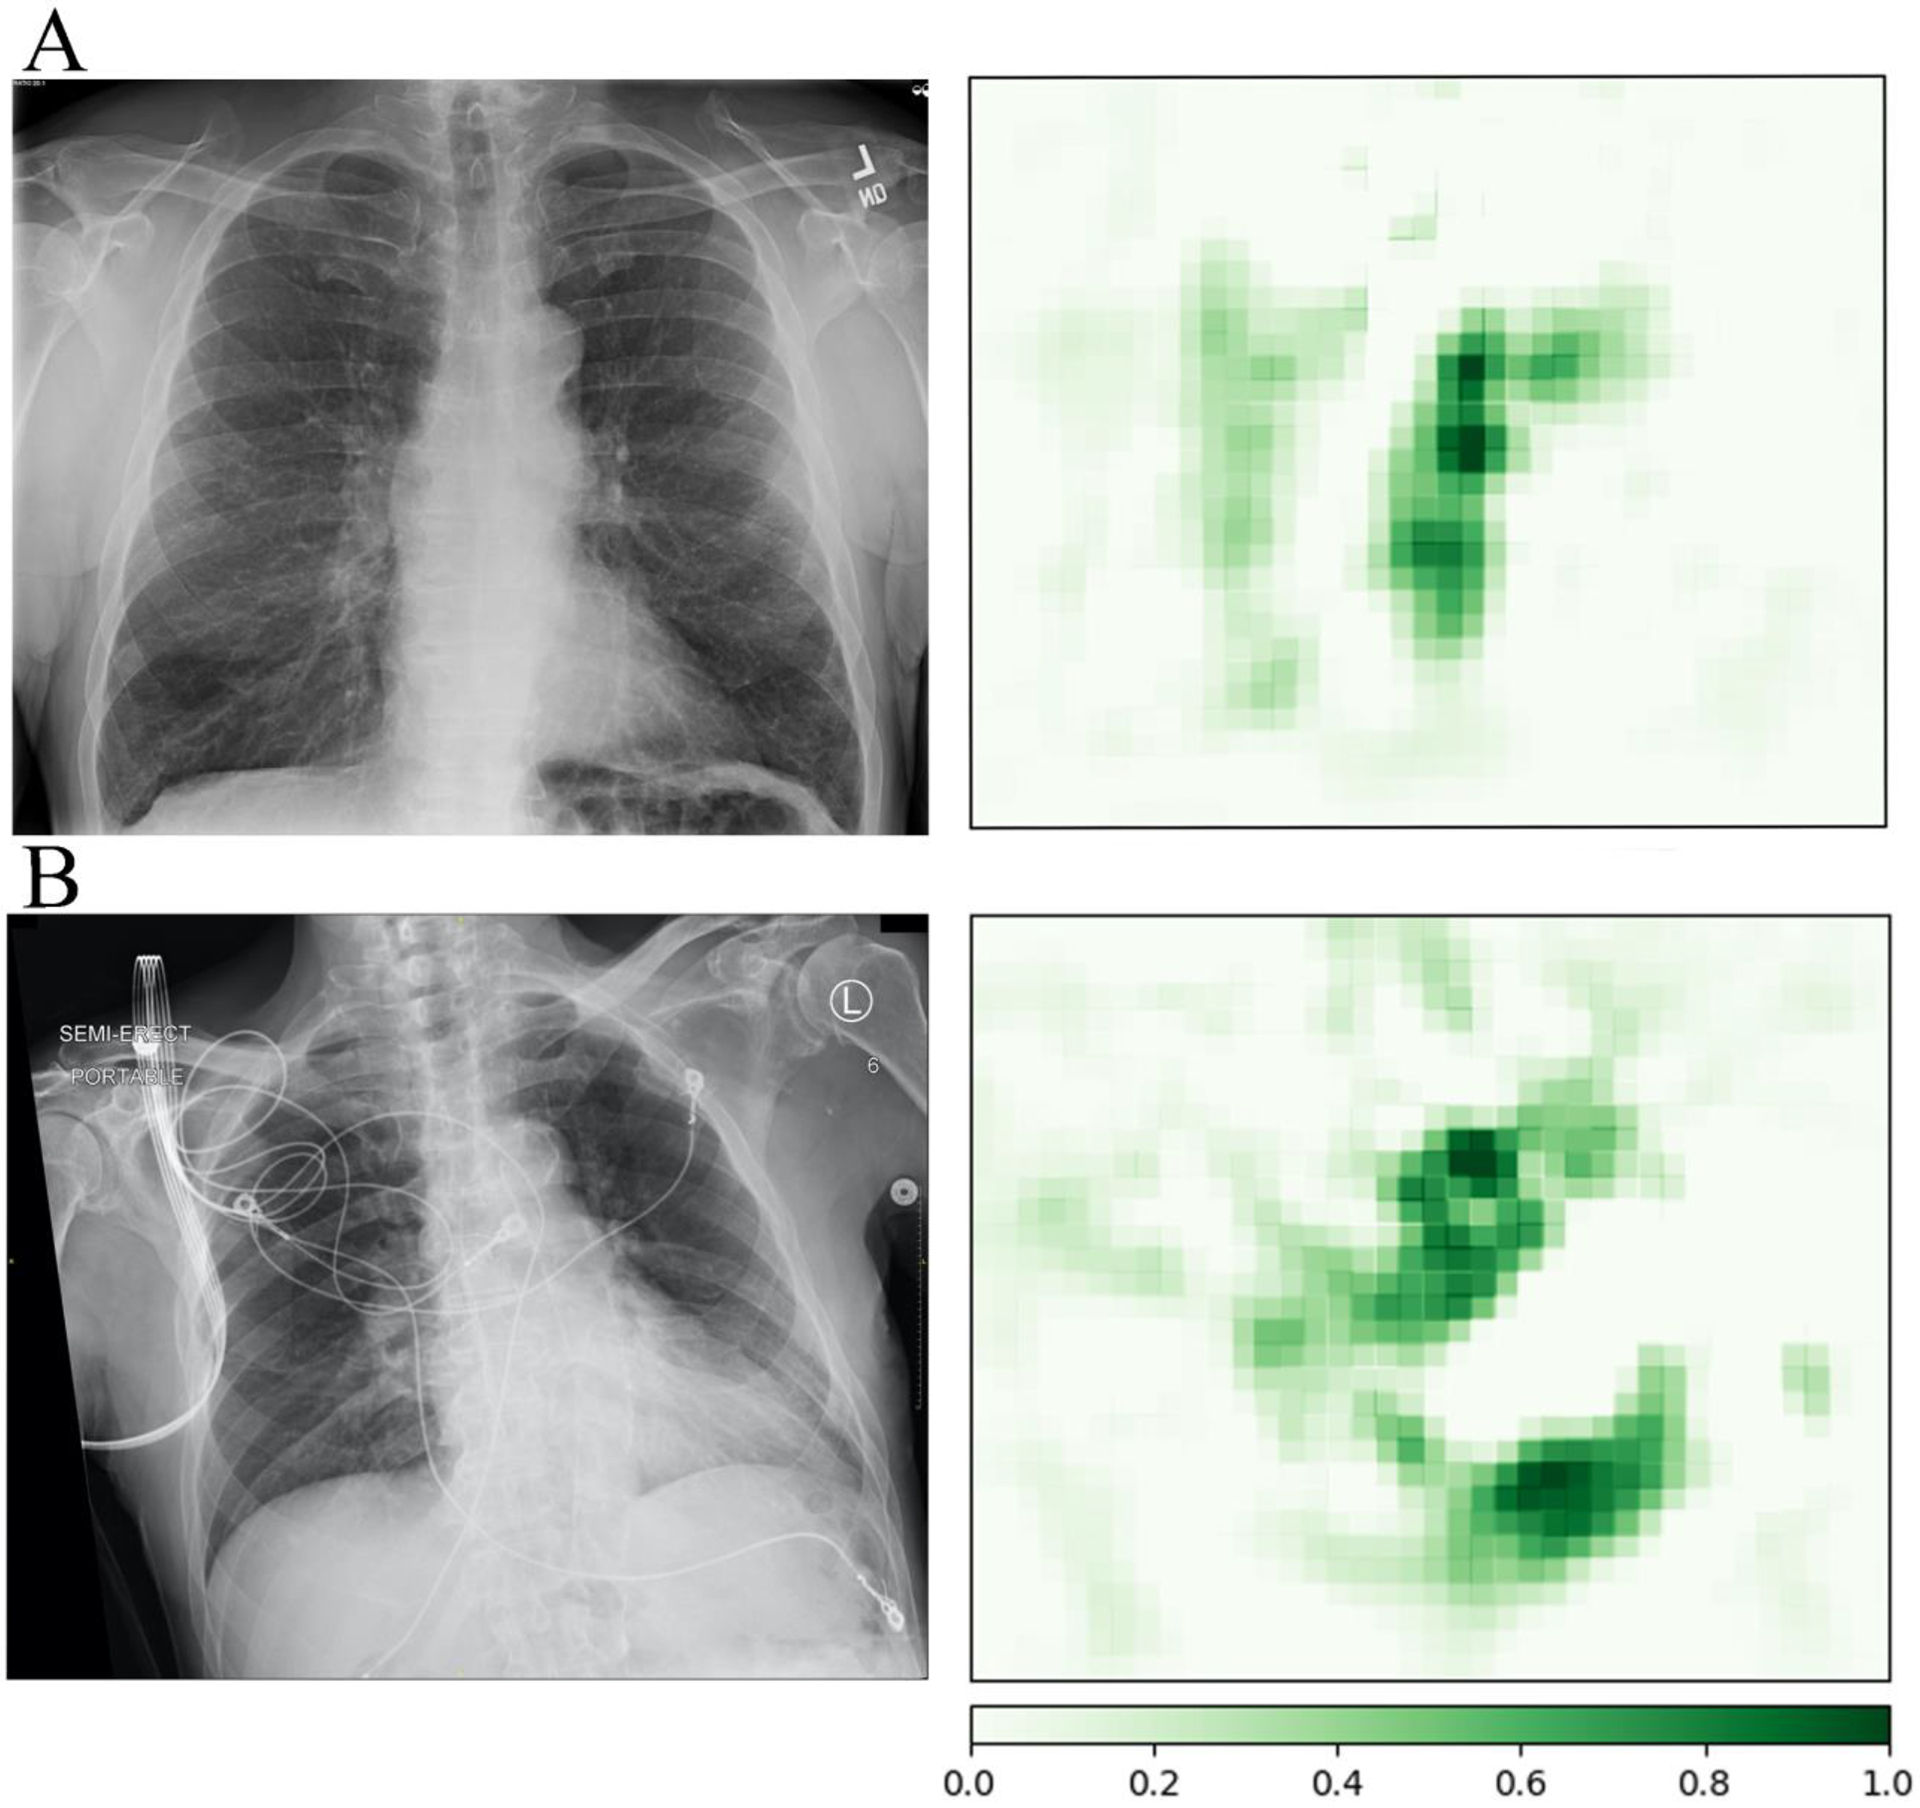
Figure 3:

Occlusion maps with the input chest radiograph on the left and output positive attribution map on the right. The darker green areas, when occluded from the image, positively impact the model’s prediction more significantly, representing a higher number on the scale. Occlusion maps for the prediction of vascular disease in a 63-year-old White male patient (A) without an associated electronic health record diagnosis code from the ambulatory cohort and an 86-year-old Black male patient (B) also without a diagnosis of vascular disease from the hospitalized cohort. Positive attributions primarily relate to the aorta, with calcified atherosclerotic visible at the aortic knob.
