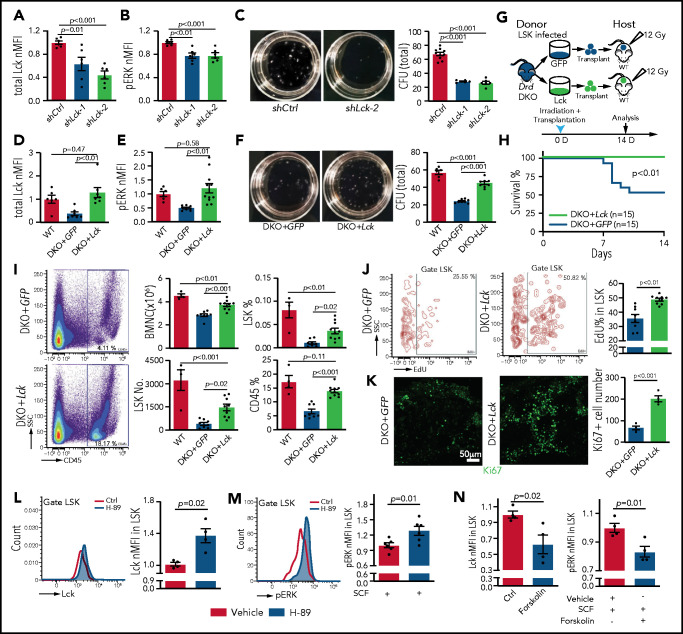
Figure 7.
Lck overexpression rescues Drd-DKO HSPC defects. Lck protein expression (A) and pERK (B) in LSK cells infected with shCtrl (control shRNA) or shLck (n = 6 per group). (C) Representative images and quantification of total CFU from LSK cells infected with shCtrl (n = 10), shLck-1 (n = 5), or shLck-2 (n = 6). Lck protein expression (D) and pERK (E) in Drd-DKO LSK cells infected with GFP or Lck virus normalized to uninfected WT LSK cells. Total Lck, n = 6-7; pERK, n = 6-10. (F) Representative images and quantification of total CFU from Drd-DKO LSK cells infected with GFP (n = 8) or Lck virus (n = 8) relative to uninfected WT LSK cells (n = 6). (G) Scheme of Drd-DKO LSK cell infection and transplantation into lethally irradiated WT mice. (H) Survival curves after transplantation with Drd-DKO LSK cells infected with GFP (n = 15) or Lck virus (n = 15). Log-rank (Mantel-Cox) test was used to calculate the P value. (I) Representative pseudocolor plot of the percentage of CD45+ cells in BM from lethally irradiated mice transplanted with DKO+GFP or DKO+Lck LSK cells (left panels). Quantitation of the numbers of BMNCs and LSK cells and the percentages of LSK cells and CD45+ cells in recipients at 14 days after irradiation and transplantation (right panels). WT = 4 mice; GFP = 8 mice; Lck =10 mice. (J) Representative plots (left and middle panels) and quantitation of the percentage (right panel) of EdU+ cells in LSK cells from mice transplanted with DKO+GFP or DKO+Lck LSK cells. GFP = 8 mice; Lck = 10 mice. The P value was calculated using the Student t test. (K) Ki67 staining in bone sections (left and middle panels) and quantitation of Ki67+ cells per image field (GFP = 4; Lck = 4; right panel) from recipients transplanted with DKO+GFP or DKO+Lck LSK cells. The P value was calculated using the Student t test. (L) Representative line graph (left panel) and quantification of normalized mean fluorescent intensity (nMFI; right panel) of total Lck after H-89 treatment ex vivo (Ctrl = 4; H-89 = 4). (M) Representative line graph (left panel) and quantification of nMFI (right panel) of pERK after H-89 treatment together with SCF ex vivo (Ctrl = 6; H-89 = 6). (N) Quantification of nMFI of total Lck (left panel) and of pERK (right) after forskolin treatment together with SCF ex vivo (Ctrl = 4; forskolin = 4). In (A-F,I), the P values were calculated using analysis of variance. Ctrl, control; SSC, side scatter.

