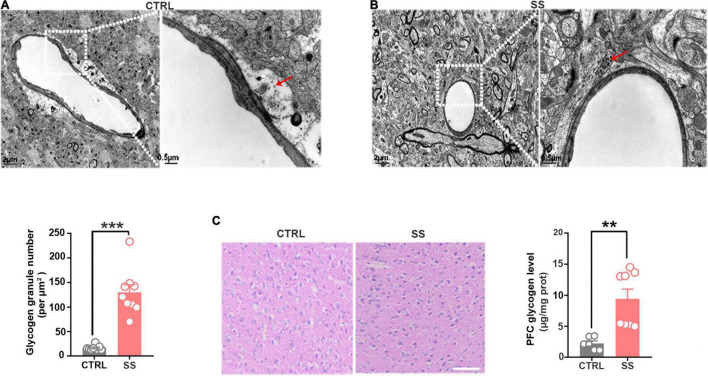
FIGURE 2.
Glycogen accumulation in the mPFC. (A) Representative electron microscopy images of glycogen distribution in the mPFC of SS mice. Red arrows indicate glycogen granules. Scale bar = 2 μm. The scale bar in the partially enlarged figure is 0.5 μm. (B) Quantitative analysis of glycogen granules in SS and control mice (n = 9). (C) PAS staining images showing the glycogen distribution in the mPFC. The glycogen level was higher in SS mice compared with control mice (n = 6). Scale bar = 50 μm. **p < 0.01, ***p < 0.001. CTRL, control mouse models; SS, stress-susceptible mouse models; PAS, Periodic acid-Schiff.

