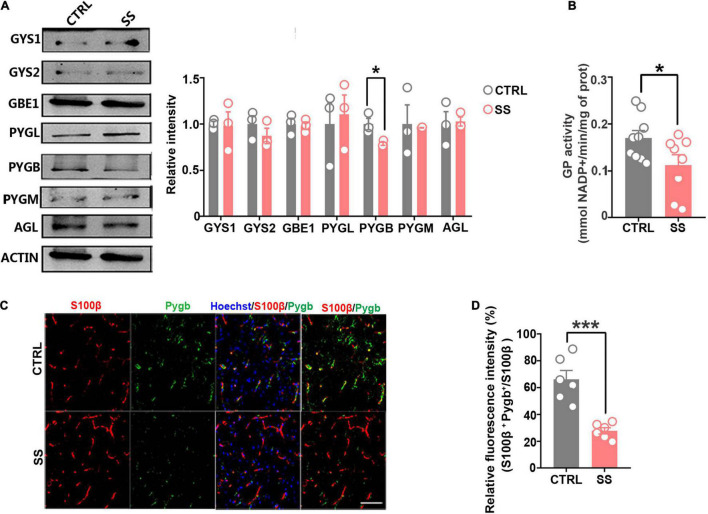
FIGURE 3.
Expression of key enzymes in glycogenesis and glycogenolysis under stress conditions. (A) Protein levels of glycogen synthase (GYS1 and GYS2), glycogen branching enzyme (GBE1), glycogen phosphorylase (PYGB, PYGM, and PYGL), and glycogen debranching enzyme (AGL) in mice under stress. The relative optical density was calculated by dividing the density of the target band by that of the corresponding β-ACTIN band (n = 3). (B) Quantified GP activities in SS mice (n = 8). (C) Immunofluorescent double staining of S100β and PYGB, scale bar = 50 μm. (D) Quantification of PYGB-relative fluorescence intensity in the medial prefrontal cortex of SS mice. PYGB-relative fluorescence intensity calculated as percentage of fluorescence intensity in the colocalization area (denoted as S100β and PYGB) divided by that in the S100β+ area (n = 6). *p < 0.05, ***p < 0.001. CTRL, control mouse models; SS, stress-susceptible mouse models.

