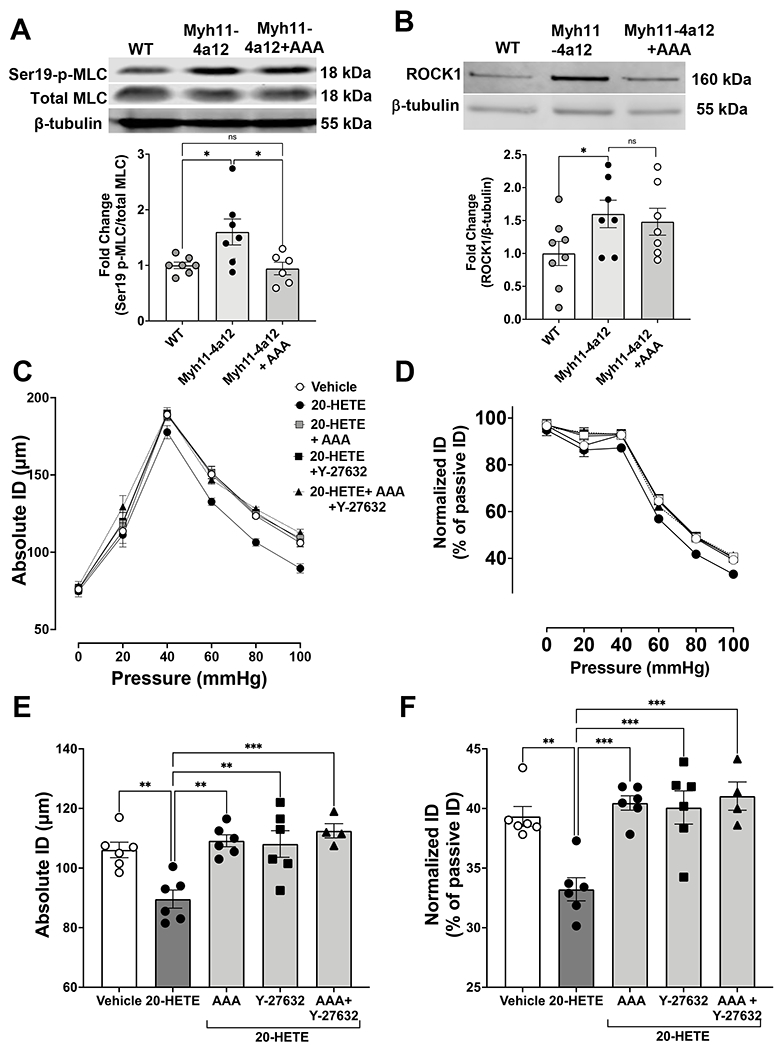
Figure 6:

A) Representative Western blots and densitometry analysis of phosphorylated myosin light chain phosphorylation (MLC) at serin 19 in mesenteric arteries. N=6-7/group). Results are means ± SE, *p<0.05 (one-way ANOVA). B) Representative Western blots and densitometry analysis of ROCK1 protein expression in RIA (N=7-8/group). Results are means ± SE, *p<0.05 (unpaired t-test). Myogenic response curve of RIA in response to 20-HETE (10 µM) with and without AAA (10 µM) and/or the ROCK inhibitor Y-27632 (10 µM) depicted as C) absolute internal diameter (ID) and D) normalized ID. Myogenic tone at 100 mmHg depicted as E) Absolute ID and F) normalized ID (N=4-6/group). Results are means ± SE, *p<0.05, **p<0.01, ***p<0.001 (one-way ANOVA).
