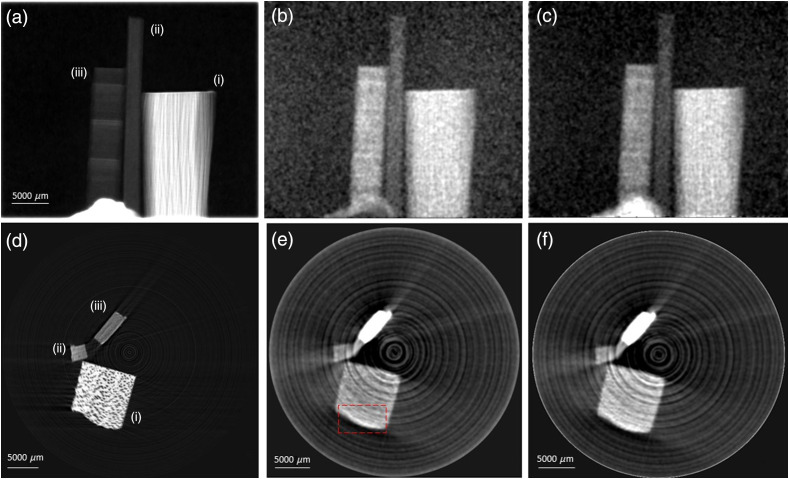
Fig. 2.
Top row: Projection images, in the direction of the optical axis, , of (a) projected thickness, (b) effective DF signal generated using a phase object approximation, and (c) attenuating object approximation of the wood sample. Bottom row: CT reconstructions of (d) attenuation coefficient, , (e) phase object approximation for the DF, and (f) attenuating object approximation for the DF. Wood labeling, (i)–(iii), refers to that in Fig. 1. All of the DF images, (b), (c), (e), and (f), were postprocessed with a five pixel standard deviation Gaussian filter.

