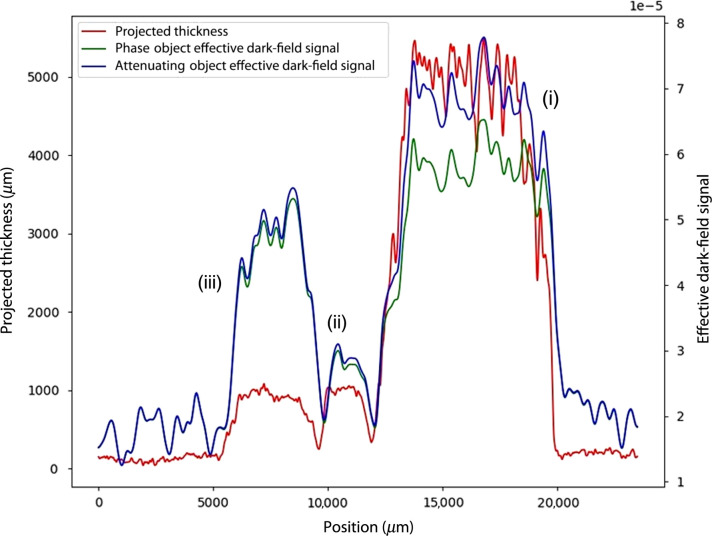
Fig. 3.
Line profiles taken across each of the wood samples in the projection images of (red) projected thickness, (green) phase object approximation DF image, and (blue) attenuating object approximation DF image. Wood labeling, (i)–(iii), refers to that in Fig. 1.

