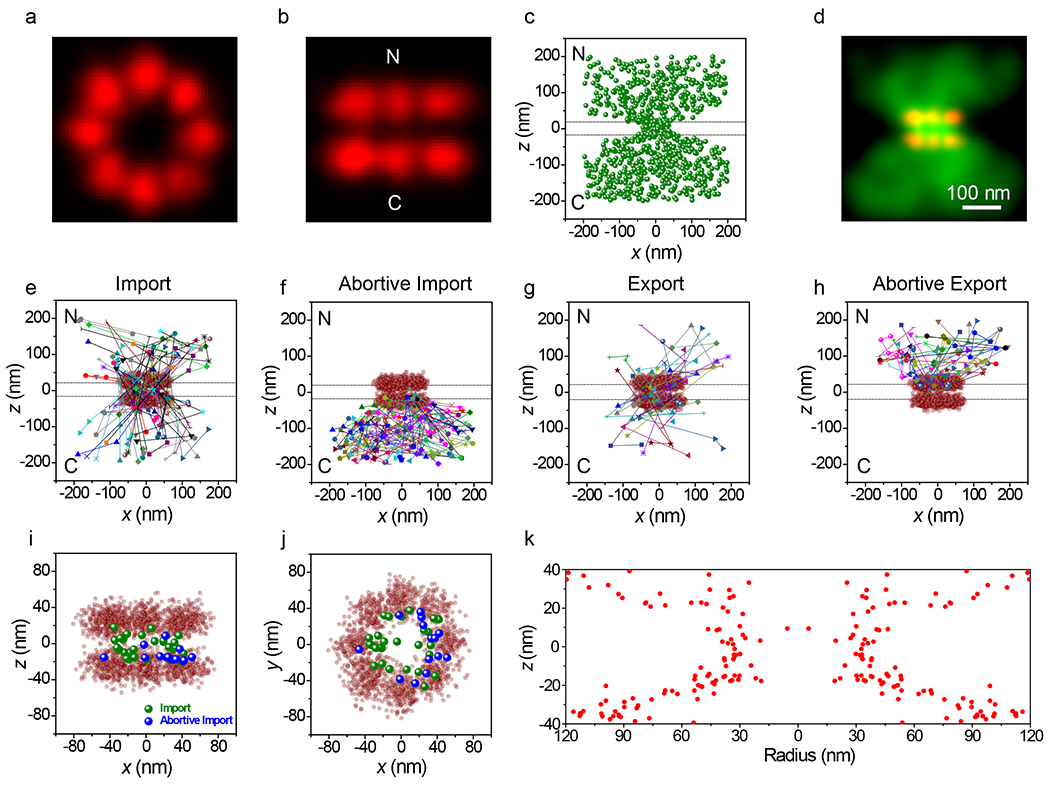
Figure 5. 3D Tracking of NLS-2xBFP Cargo Complexes Interacting with and Transiting Through NPCs.

a,b, Composite NPC images, shown from the cytoplasm (a) and from the side (b). Visual comparison with Fig. 2k,l reveals the structural reproducibility. A quantitative comparison is given in Table 1. c,d, Localizations for NLS-2xBFP/Imp α/Imp β cargo complexes detected in three or more consecutive frames (N = 882 localizations from 115 NPCs from 10 nuclei; each nucleus was an independent biological replicate) in localization (c) and Gaussian rendered (d) maps. Total acquisition time per nucleus for cargo complex localizations was ~2 min (2 ms/frame, λex = 532 nm, 100 kW/cm2). Eliminated localizations (particles visible for 1 or 2 frames) appear randomly distributed (Extended Data Figs. 5c,d). The two horizontal dashed lines (0±20 nm) in c indicate the approximate location of the nuclear envelope membranes. [Imp α(Atto542)] = 1 nM, [Imp β] = 0.5 μM, [NLS-2xBFP] = 0.5 μM, [RanGDP] = 1.5 μM, [NTF2] = 1 μM, [GTP] = 1 mM. e-h, Representative trajectories. Select trajectories (from N = 196 trajectories a selected from the data in c,d) separately identified as (e) Import (34%), (f) Abortive Import (36%), (g) Export (13%), and (h) Abortive Export (17%). i,j, Distribution map of localizations from import and abortive import trajectories within the NPC scaffold (z = 0±20 nm), shown from the side (i) and from the cytoplasm (j). k, The z-dependent radial distribution of the localizations from import and abortive import trajectories within the central pore region (compare with Fig. 4k). Source numerical data are provided in source data.
