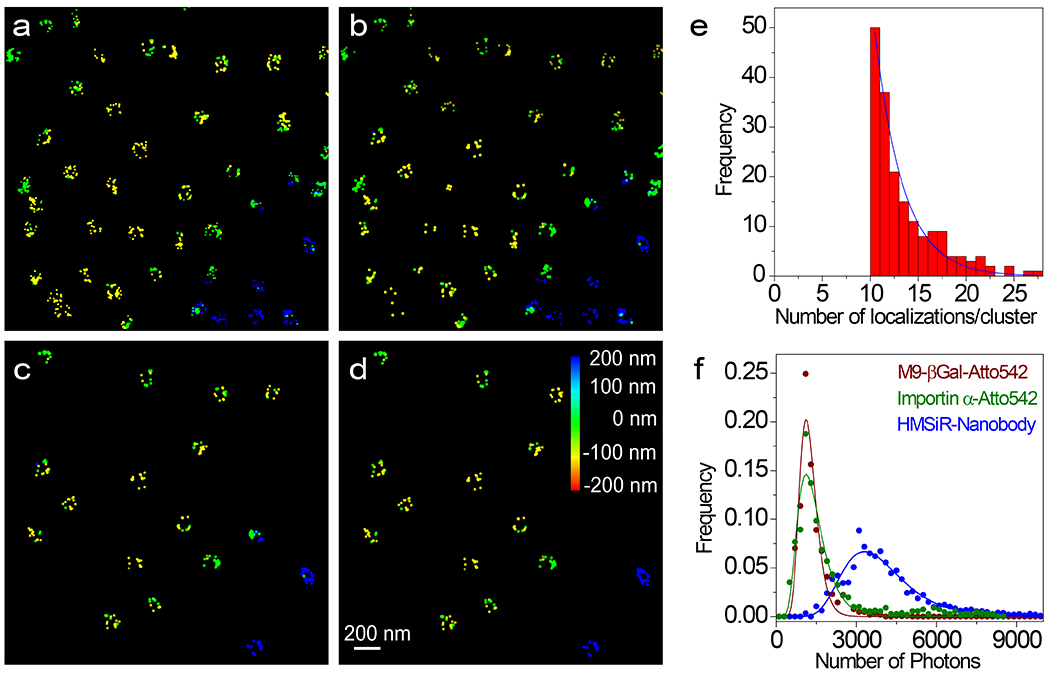
Extended Data Fig. 2. Workflow for NPC Cluster Selection.

a, Initial image obtained from ThunderSTORM. b, Image after photon filtering (≥ 3000 photons) and z filtering (0±300 nm) (corresponds to Fig. 2e). c, Clusters remaining after applying a rough diameter threshold (59-153 nm) and with ≥ 10 localizations/cluster. d, Clusters remaining after the double-circle fit and subsequent curating (fit diameter = 80-135 nm; distance between the rings = 40-65 nm; z-centroid = 0±200 nm). These remaining clusters are considered well-localized NPCs (image corresponds to Fig. 2h), and were used to construct the composite images in Figs. 2i–l. Dye localizations are color-coded based on z-height. e, Distribution of the number of localizations per cluster for the experiment in Fig. 2. The number of localizations per cluster followed an approximately exponential distribution (decay constant = 2.9) with an average of 13.2 following the filtering described in (a-c) and with a z-centroid = 0±200 nm (N = 2362 total localizations obtained from 142 clusters from 10 nuclei; each nucleus was an independent biological replicate). f, Photon frequency histograms. The HMSiR-labeled nanobody was bound to NPCs (Fig. 2) and the Atto542-labeled M9-βGal and Imp α were undergoing transport (Figs. 4 and 5). The log-normal fit parameters were used for the simulations in Supplementary Data 1_Software File 1 and Supplementary Data 2_Software File 2. Source numerical data are provided in source data.
