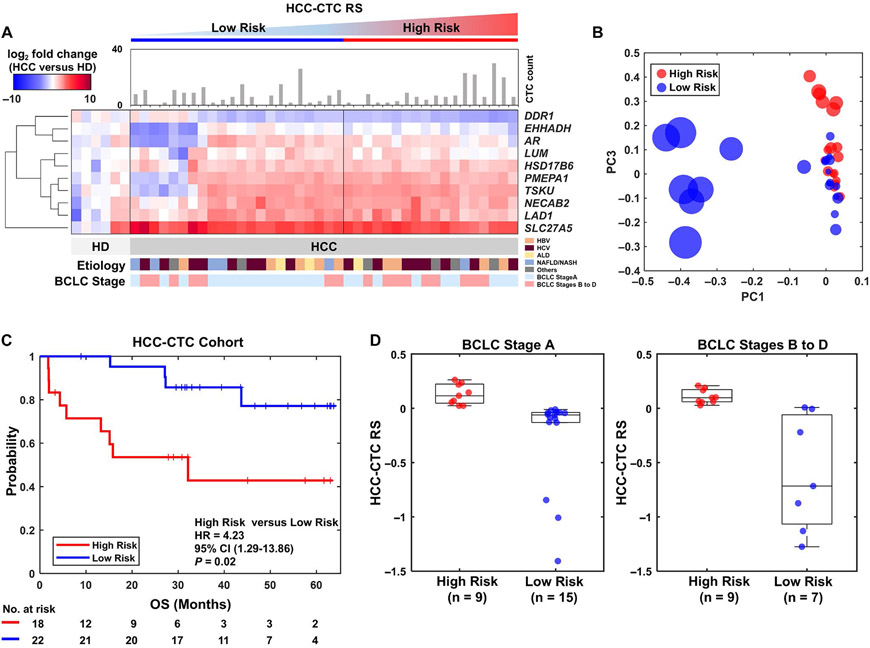
FIG. 4.
HCC-CTC mRNA scoring system for quantification of the HCC-CTC RS panel using clinical blood samples in an independent HCC-CTC cohort. (A) The HCC-CTC count and the heatmap of the HCC-CTC RS panel expression patterns from 40 patients with HCC and 6 healthy donors. The color bar represents gradients of log2 fold change of the genes between patients with HCC and healthy donors. The patients with HCC are sorted by increasing HCC-CTC RS from left to right, with low-risk and high-risk groups defined by the exact same threshold from the TCGA HCC cohort. (B) PCA result using the risk activity of the HCC-CTC RS panel showing the distribution of 40 patients. The size of node represents the absolute HCC-CTC RS, and the red and blue nodes represent the high-risk and low-risk groups, respectively. (C) Kaplan–Meier curve analysis of OS in the HCC-CTC cohort stratified by HCC-CTC RS (P = 0.02). (D) Box plot showing the distribution of the HCC-CTC RSs in BCLC stage A high-risk group, BCLC stage A low-risk group, BCLC stages B to D high-risk group, and BCLC stages B to D low-risk group.

