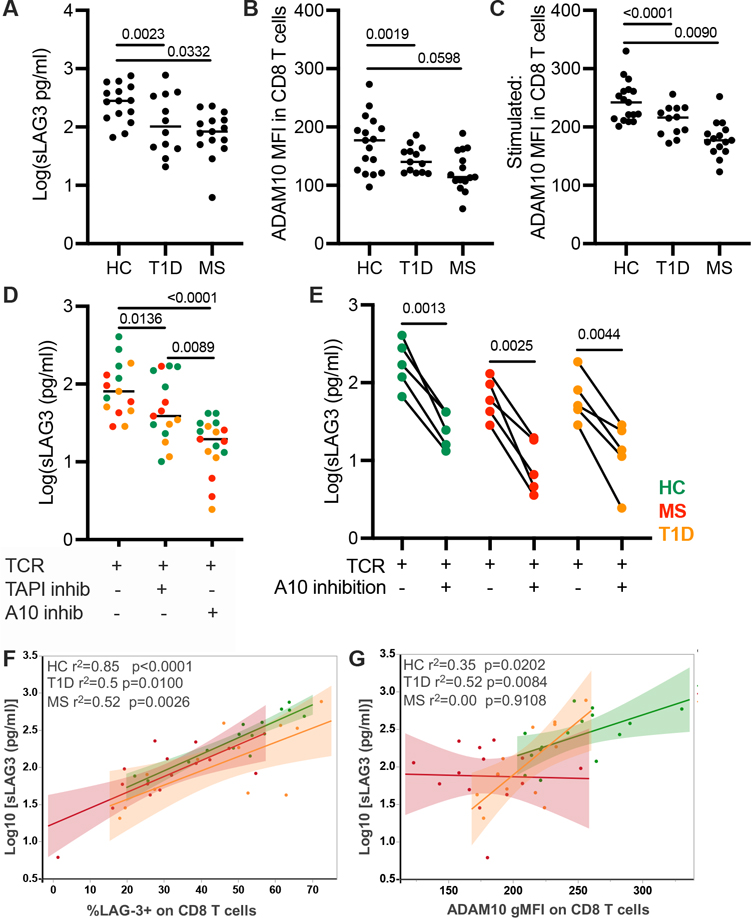
FIGURE 2.
The role of surface LAG-3 expression and ADAM10 expression in the generation of soluble LAG-3 (sLAG3). (A) The concentration of sLAG3 after 48-h TCR stimulation of CD3+ T cells. (B) The gMFI of ADAM10 in unstimulated CD8 T cells and (C) after a 48-h TCR stimulation. (D) Concentration of sLAG3 after 48-h TCR stimulation with or without the addition of the pan-metalloproteinase inhibitor, TAPI-1 or the ADAM10-inhibitor, GI254023X. (E) Concentration of sLAG3 after TCR stimulation and with ADAM10 inhibition in paired subjects. Results from one experiment, HC, n = 5; T1D, n = 4; RRMS, n = 4. (F) The frequency of CD8 T cell surface LAG-3 versus the concentration of sLAG3 after TCR stimulation in HC, RRMS, and T1D subjects (p < 0.0001, r2 = 0.6390 for all subjects). (G) The gMFI of ADAM10 on CD8 T cells versus the concentration of sLAG3 after TCR stimulation (p < 0.0001, r2 = 0.3450 for all subjects). Results from two independent experiments, HC (green), n = 17; RRMS (red), n = 15; and T1D (orange), n = 13. Lines shown are median and p values are shown after a (A-C) one-way ANOVA, (D, E) paired t test, and (F, G) Spearman correlation test.

