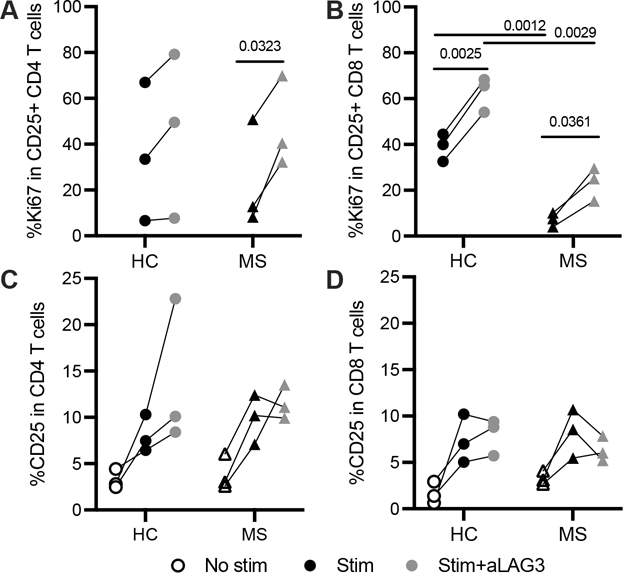
FIGURE 5.
T cell proliferation after low-dose antigen stimulation and LAG-3 inhibition. Frequency of Ki67 after PBMC peptide stimulation (CMV/Adv5, 175 ng/ml, 6 days) in activated (A) CD4 and (B) CD8 T cells after subtracting the frequency of Ki67 in unstimulated T cells. Frequency of CD25 in (C) CD4 and (D) CD8 T cells. Unstimulated in blue; peptide-stimulated in black; peptide-stimulated with aLAG3 in light gray. ⚫ HC, ▲ RRMS. P values are paired or unpaired t tests. Results are from a single experiment, 3 HC and 3 RRMS subjects.

