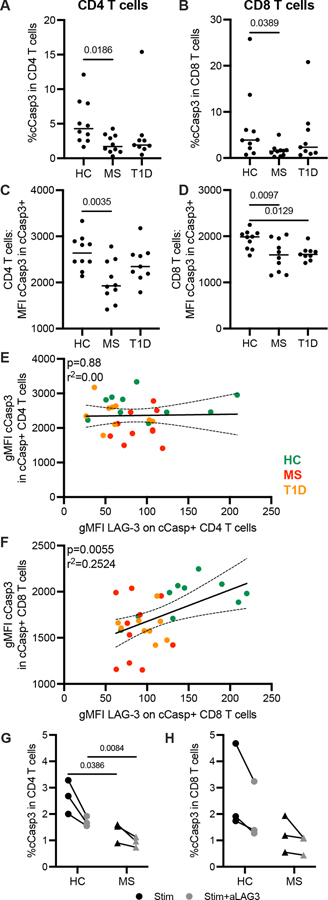
FIGURE 7.
Cleaved caspase-3 expression and response to LAG-3 inhibition. Frequency of cleaved caspase 3 (cCasp3) in resting (A) CD4 and (B) CD8 T cells from HC, RRMS, and T1D subjects. Geometric MFI of cCasp3 within cCasp3+ (C) CD4 and (D) CD8 T cells. Correlation of geometric MFI of LAG-3 versus cCasp3 in cCasp3+ (E) CD4 and (F) CD8 T cells. Results are from two independent experiments, HC, n = 10; RRMS, n = 10; T1D, n = 10. Frequency of cCasp3 after peptide stimulation in (G) CD4 and (H) CD8 T cells. Results are from a single experiment, 3 HC and 3 RRMS subjects. Lines shown are median, and p values are shown after a one-way ANOVA (A-D), a Spearman correlation with 95% confidence interval shown (E, F) and an unpaired t-test (G, H).

