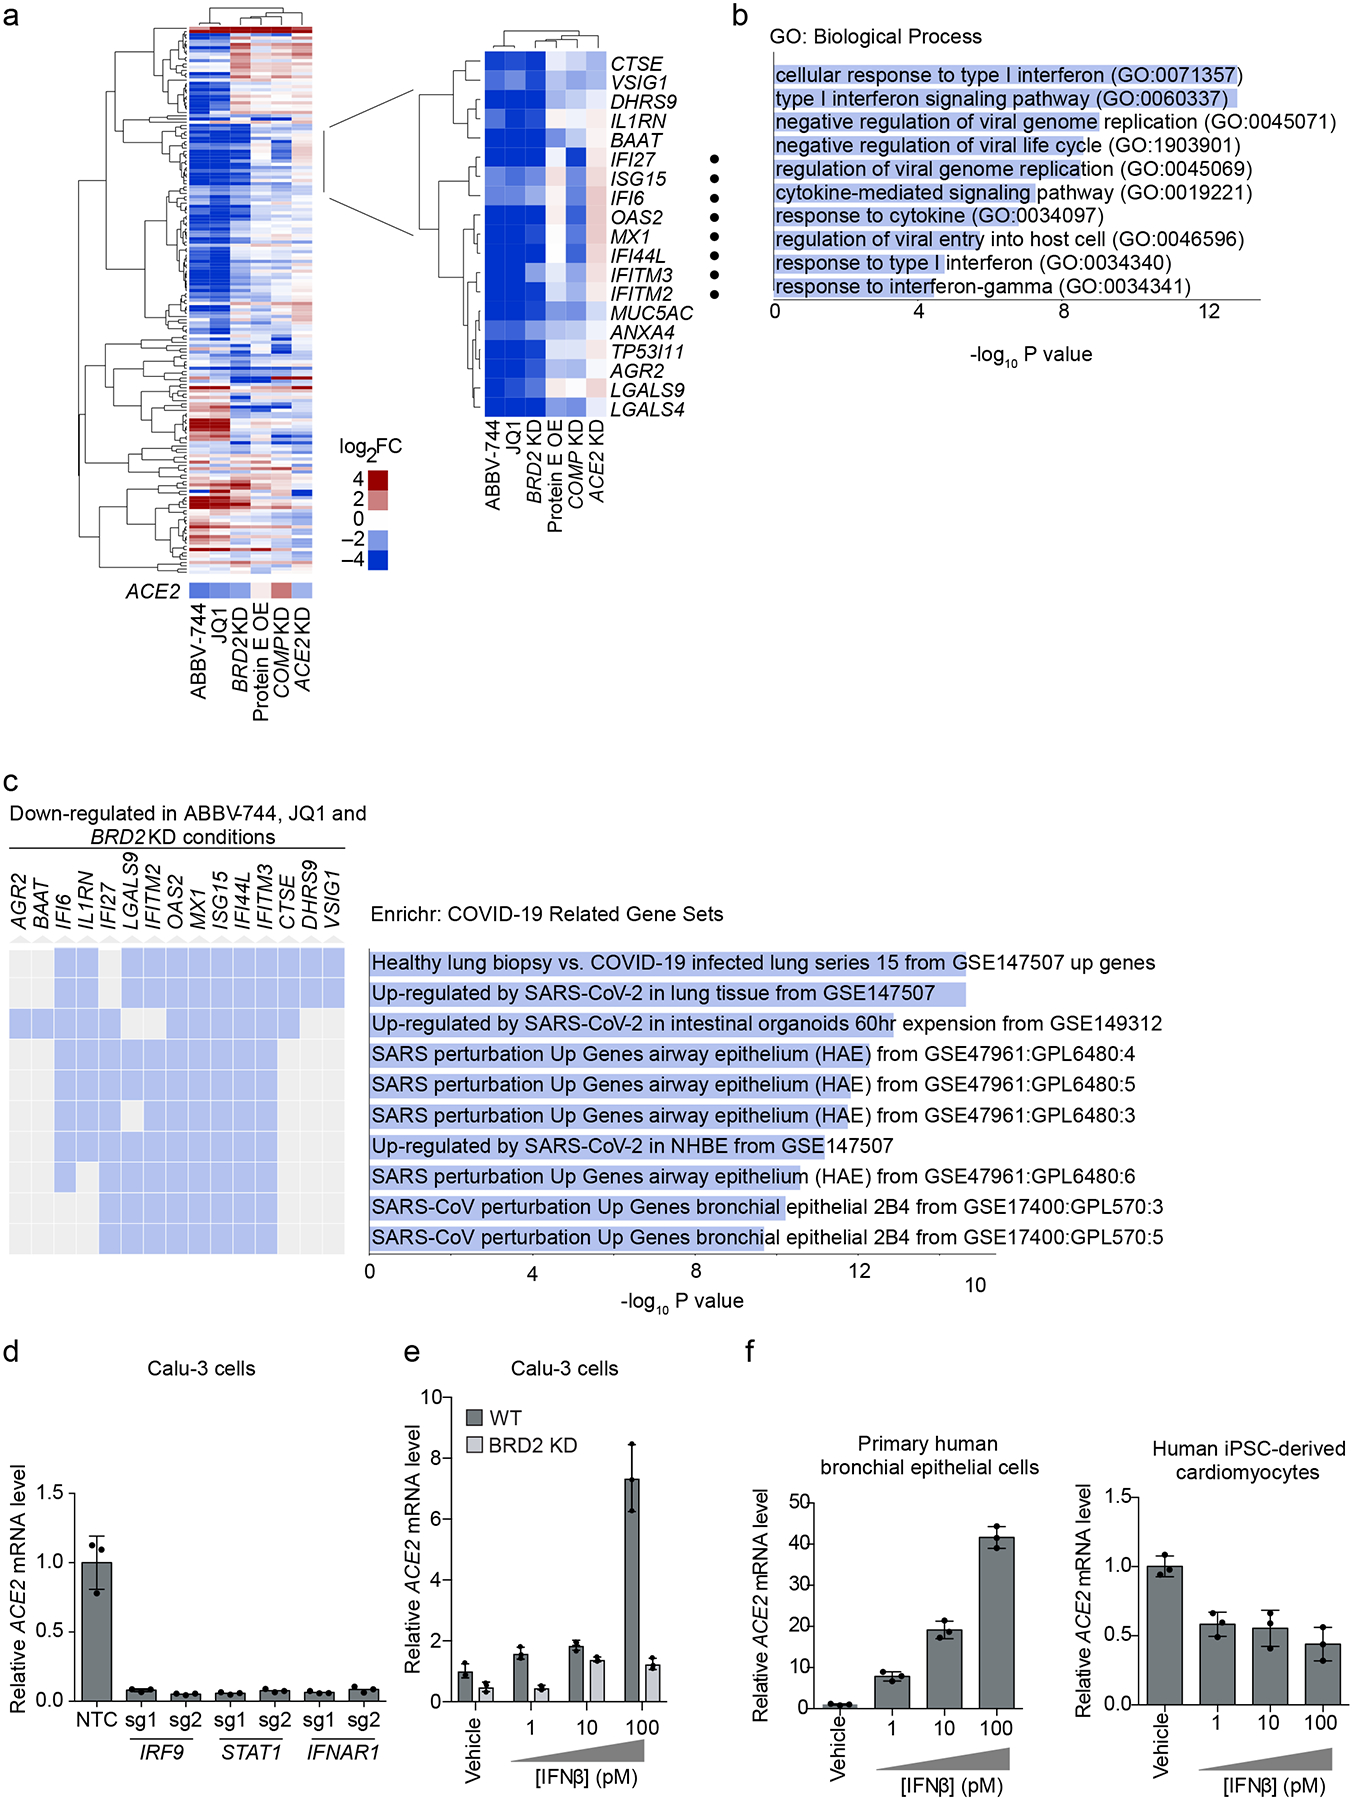
Figure 4: BRD2 controls genes induced by interferon and SARS-CoV-2 infection.

a, Differentially expressed genes (DEGs) from RNA sequencing of Calu-3 cells under different treatment conditions compared to control cells: 72-hour treatment with 10 μM JQ1 or 10 μM ABBV-744, BRD2 knockdown (KD), SARS-CoV-2 protein E overexpression (OE), COMP KD, ACE2 KD. Quasi-likelihood method glmQLFTest was implemented in edgeR. P values were adjusted for multiple comparisons using the Benjamini-Hochberg method. Heatmap showing log2-fold change (log2FC) relative to untreated controls for each condition (columns) for genes (rows) among top 50 DEGs (by P values) in at least one condition. ACE2 was not among these genes and is shown as a separate row. Insert, a cluster of genes down-regulated upon both BRD2 inhibition and BRD2 knockdown. Among these, genes associated with the GO term “Cellular Response to Type I interferon” are marked by black dots. b, Significantly enriched (FDR < 0.05) GO biological process terms for the genes shown in the inset in (a). c, Enrichment analysis for genes in the inset in (a) reveals COVID-19 related gene sets. Genes associated with a gene set are marked in blue. d, Calu-3 cells expressing sgRNAs knocking down genes essential for interferon signaling assayed for ACE2 gene expression relative to ACTB by qPCR. Average ACE2 mRNA level relative to non-targeting control (NTC) sgRNA and standard deviation of 3 biological replicates are shown for each condition. e, WT (dark grey) or BRD2 KD (light grey) Calu-3 cells were treated with interferon-beta (IFNβ), and transcript levels of ACE2 relative to ACTB were quantified at 72 hours post-treatment by qPCR. Average ACE2 levels relative to vehicle treated and standard deviation of 3 biological replicates are shown for each condition. f, Primary human bronchial epithelial cells (left) and human iPSC-derived cardiomyocytes (right) were treated with the indicated concentrations of interferon-beta (IFNβ), and transcript levels of ACE2 relative to ACTB (for Calu-3 and primary human bronchial epithelial cells) or 18S rRNA (cardiomyocytes) were quantified at 72 hours post-treatment by qPCR. Average ACE2 mRNA levels relative to WT and standard deviation of 3 biological replicates are shown for each condition.
