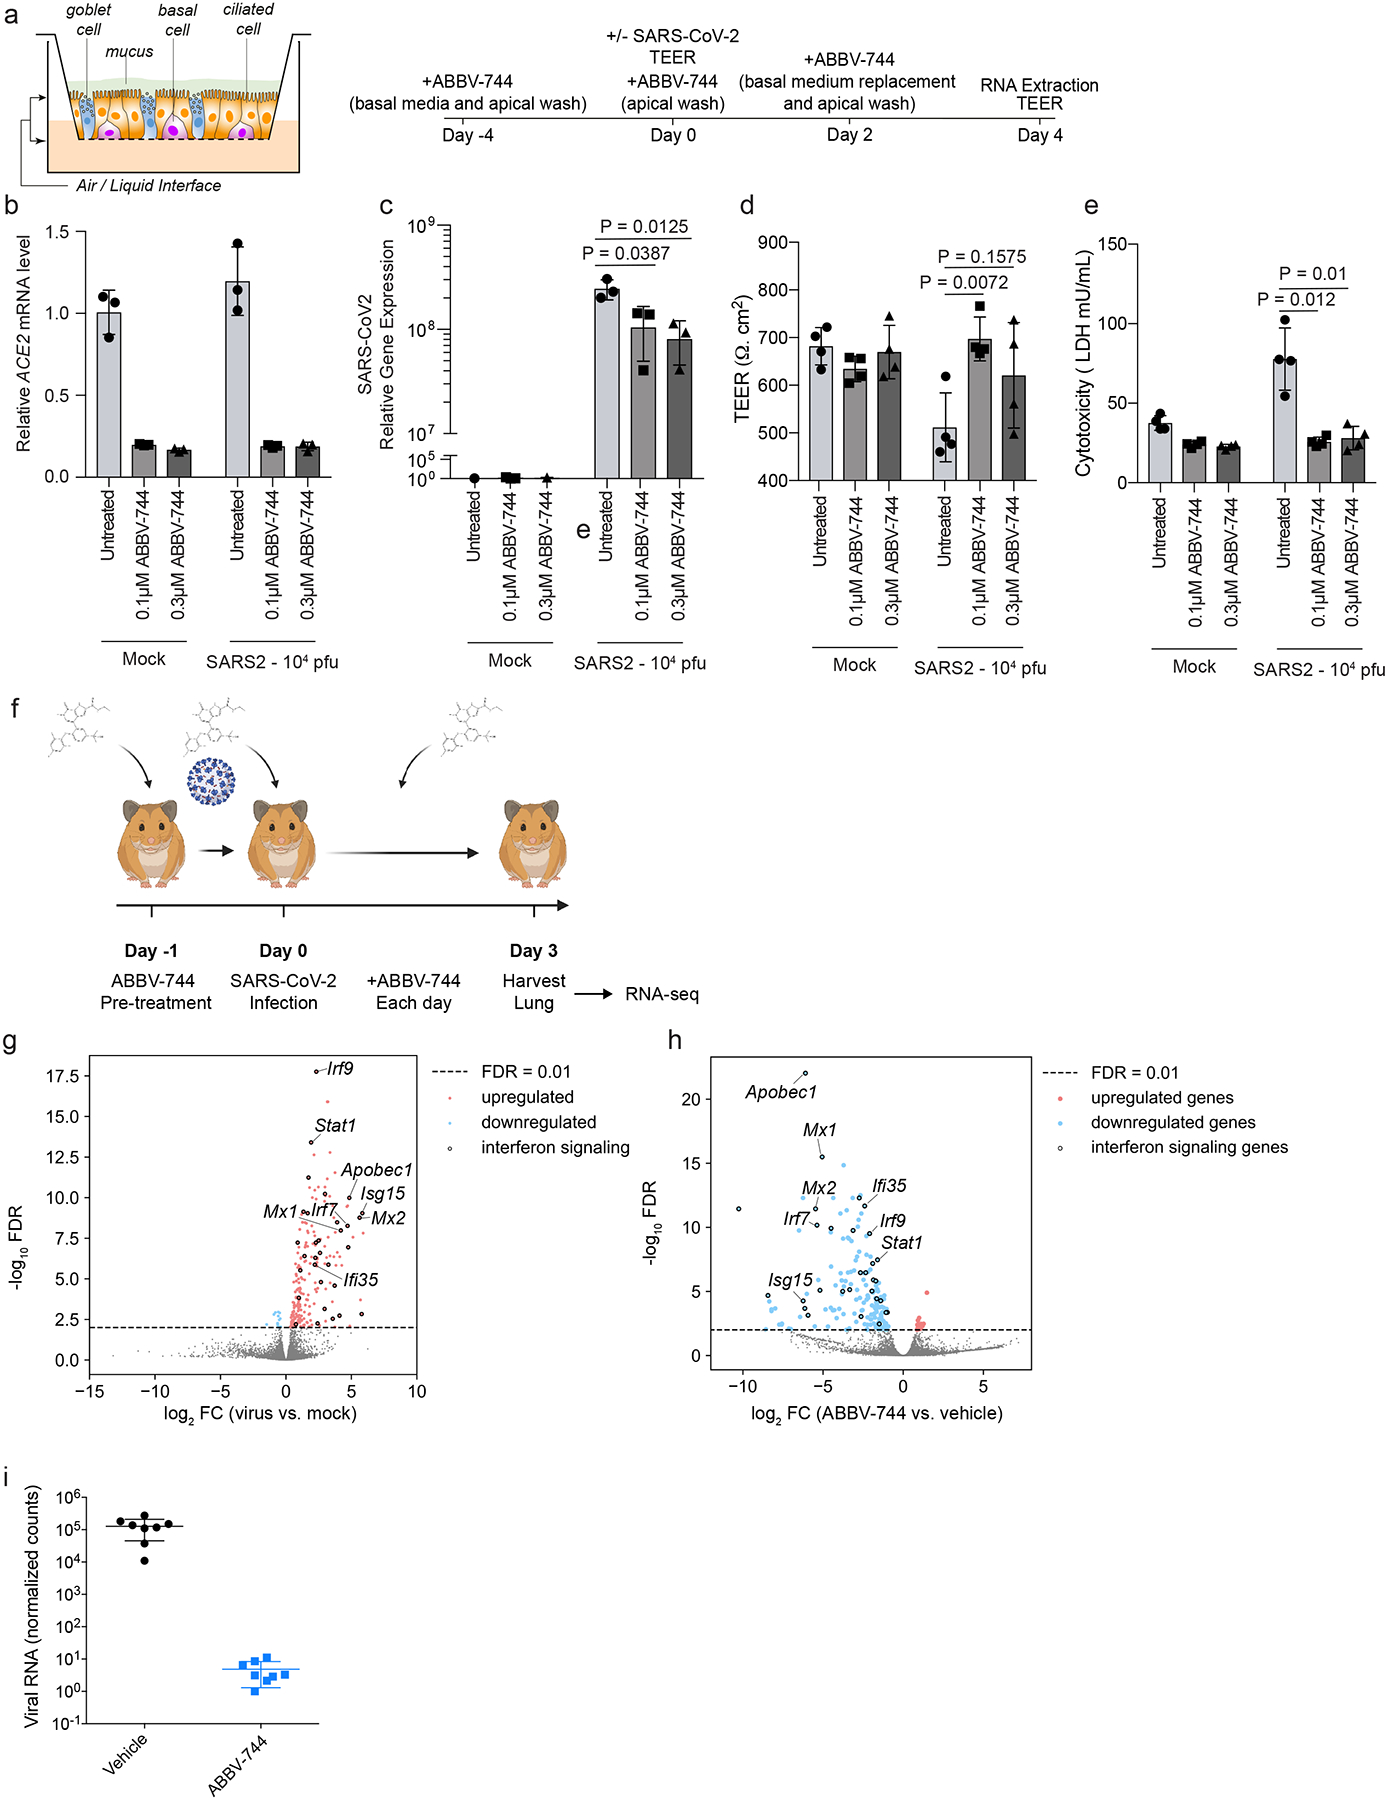
Figure 6: Brd2 inhibitors prevent cytotoxicity and reduce SARS-CoV-2 infection in human primary nasal epithelia and inhibit SARS-CoV-2 infection in Syrian Hamsters.

a, Design for reconstructed human nasal epithelia experiments. b, ACE2 transcript levels relative to the average of GAPDH, TFRC, RPL13, and ACTB as a function of ABBV-744 concentration and/or SARS-CoV-2 infection (right). The average ACE2 mRNA level relative to mock infection and vehicle treated of n = 3 biological replicates with error bars representing the standard deviation are shown. c, intracellular SARS-CoV-2 gene expression (N) relative to the average of GAPDH, TFRC, RPL13, and ACTB as a function of ABBV-744 concentration and/or SARS-CoV-2 infection (right). The average of n = 3 biological replicates with error bars representing the standard deviation are shown. P-value was determined using Student’s unpaired two tailed t-test. SARS-Cov-2 gene expression relative to mock infection and vehicle treated are shown. d, Transepithelial electrical resistance (TEER), evaluated as a function of ABBV-744 concentration and/or SARS-CoV-2 infection. The average of n = 4 biological replicates with error bars representing the standard deviation are shown. P-value was determined using Student’s unpaired two tailed t-test. e, Cytotoxicity, as measured by lactate dehydrogenase (LDH) release, evaluated as a function of ABBV-744 concentration and/or SARS-CoV-2 infection. The average of n = 4 biological replicates with error bars representing the standard deviation are shown. P-value was determined using Student’s unpaired two tailed t-test. f, Experimental design for Syrian hamster experiments. g, Volcano plot showing differentially expressed genes for Syrian hamsters lungs infected or not with SARS-CoV-2. A subset of ISGs for which BRD2 peaks were identified by CUT&RUN are labeled. h, Volcano plot showing differentially expressed genes for Syrian hamsters lungs infected with SARS-CoV-2 and treated with vehicle or ABBV-744 at 100nM. A subset of ISGs for which BRD2 peaks were identified by CUT&RUN are labeled. i, Normalized viral RNA counts for Syrian hamsters infected with SARS-CoV-2 and treated with vehicle or ABBV-744 at 100 nM. The average of n = 8 biological replicates with error bars representing the standard deviation are shown. P-value was determined using Student’s unpaired two tailed t-test.
