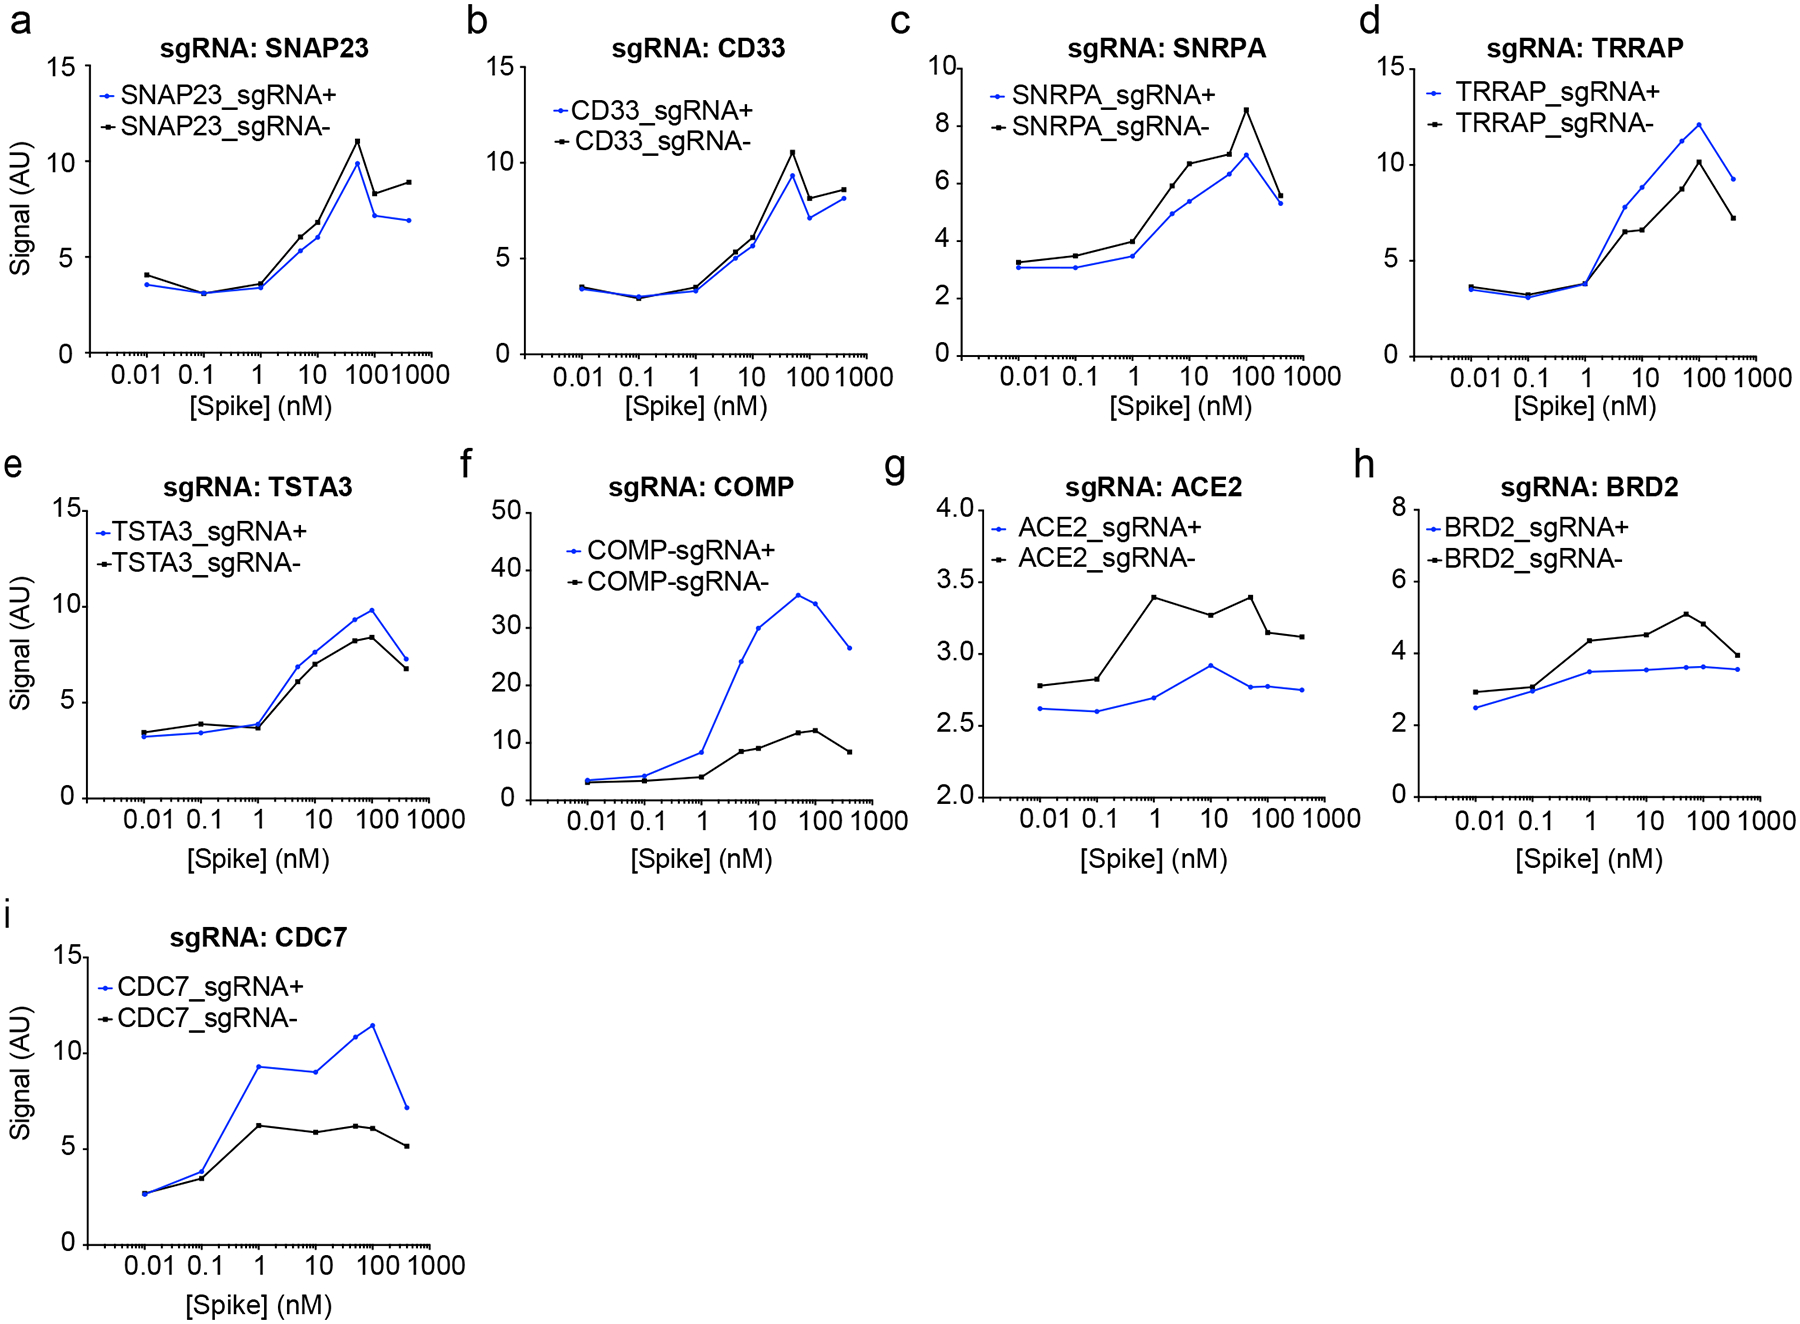
Extended Data Fig. 2. Individual sgRNA re-test of screening hits.

a-i, Spike-RBD signal measured by flow-cytometry as a function of Spike-RBD concentration. Blue lines represent cells expressing the sgRNA targeting the gene of interest, black lines represent un-transduced control cells in the same well. Average of two technical replicates are shown.
