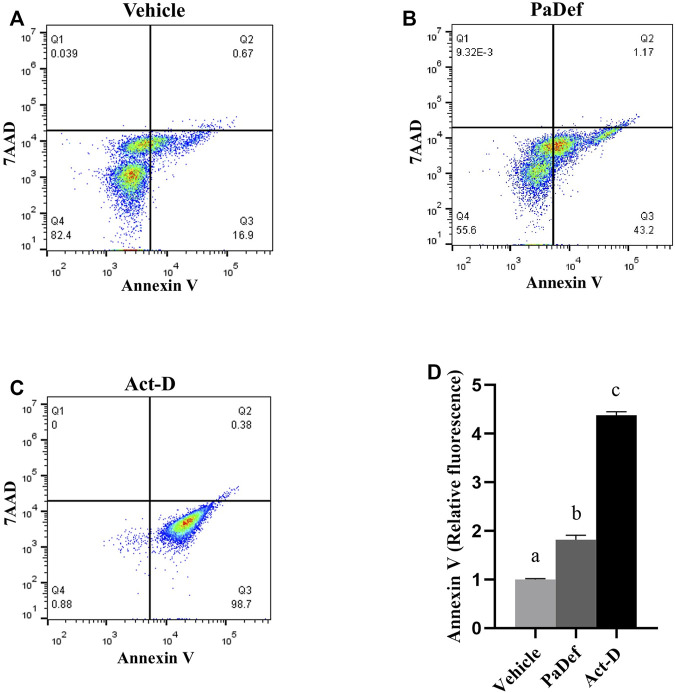
FIGURE 3.
PaDef antimicrobial peptide induces apoptosis in Jurkat acute lymphoid leukemia line. Representative flow cytometry plots of the different treatments are shown; (A) Vehicle (DMSO 0.98%); (B) PaDef (47.3 μM); (C) Actinomycin D 0.5 μM (Act-D). Annexin V/7AAD staining was used to establish the apoptotic rate. Quadrants indicate viable cells (lower left quadrant), early apoptosis (lower right quadrant), late apoptosis (upper right quadrant), and necrotic cells (upper left quadrant). (D) The graph shows the relative fluorescence units for each condition. Each bar shows the mean of triplicates ± SE of three independent experiments. A minimum of 7,000 events per sample was collected. Different letters denote significant differences within the treatments (one-way ANOVA and Tukey´s comparison, p ≤ 0.05).

