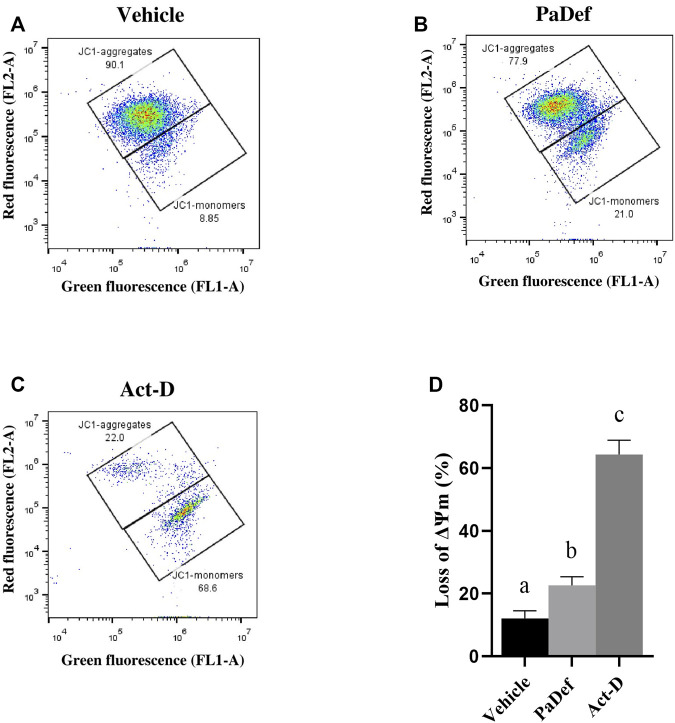
FIGURE 5.
Antimicrobial PaDef peptide induces loss of mitochondrial membrane potential (ΔΨm) in Jurkat cells. Representative plots are shown. Cells were treated for 24 h with (A) vehicle (DMSO 0.98%), (B) PaDef (47.3 μM) or (C) Actinomycin D (0.5 μM, Act-D). Cells were stained with JC-1 dye and fluorescence was measured by flow cytometry. (D) The graph shows the percentage of loss of membrane potential for each treatment. Each bar shows the mean of triplicates ± SE of three independent experiments. Different letters denote significant differences (the same letter denotes no difference) in all values compared with each other (One-way ANOVA and Tukey’s pairwise comparison, p ≤ 0.05).

