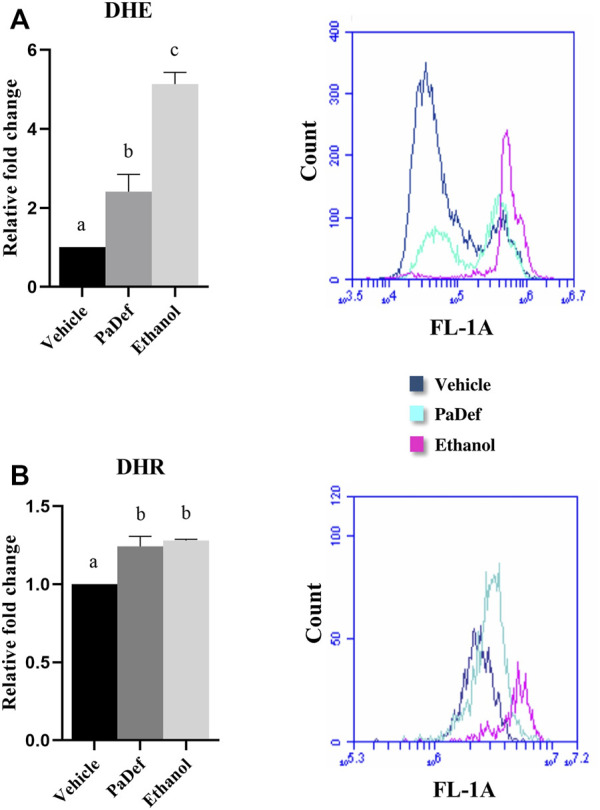
FIGURE 6.

PaDef induces reactive oxygen species (ROS) generation in the Jurkat cell line. Cells were treated for 24 h: PaDef (47.3 μM), 0.98% DMSO Vehicle or 12% ethanol. Cells were subsequently stained with the indicators DHE (dihydroethidium) (A) and DHR (dihydrorhodamine) (B) and analyzed by flow cytometry. A representative image of a flow cytometry plot is shown. Each bar shows the mean of triplicates ± SE of two independent experiments. Different letters indicate statistically significant differences based on the vehicle (p ≤ 0.05) and were compared using one-way ANOVA and Tukey post hoc test (p ≤ 0.05).
