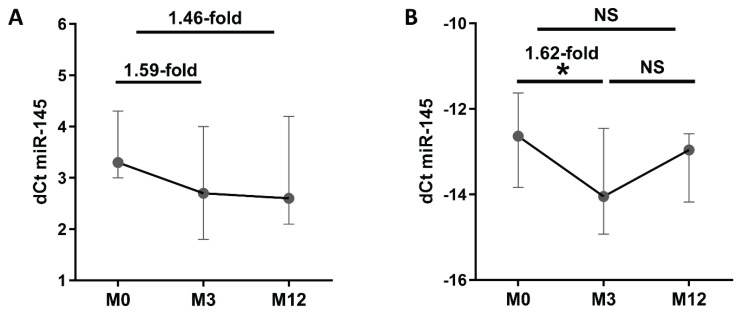
Fig. 1.
Plasma expression of miR-145 at baseline, month 3, and month 12 of anti-TNF therapy. (A) Expression analyzed using comprehensive TaqMan Low Density array and (B) single assay validation. Data expressed as median with interquartile range. NS, not significant. * p≤0.05 dCt was calculated as follows: (A) dCt=Ct(array average)-Ct(miRNA of interest) and (B) Ct(spike-in average)-Ct(miRNA of interest). Higher dCt values represent, therefore a higher expression of miR-145.

