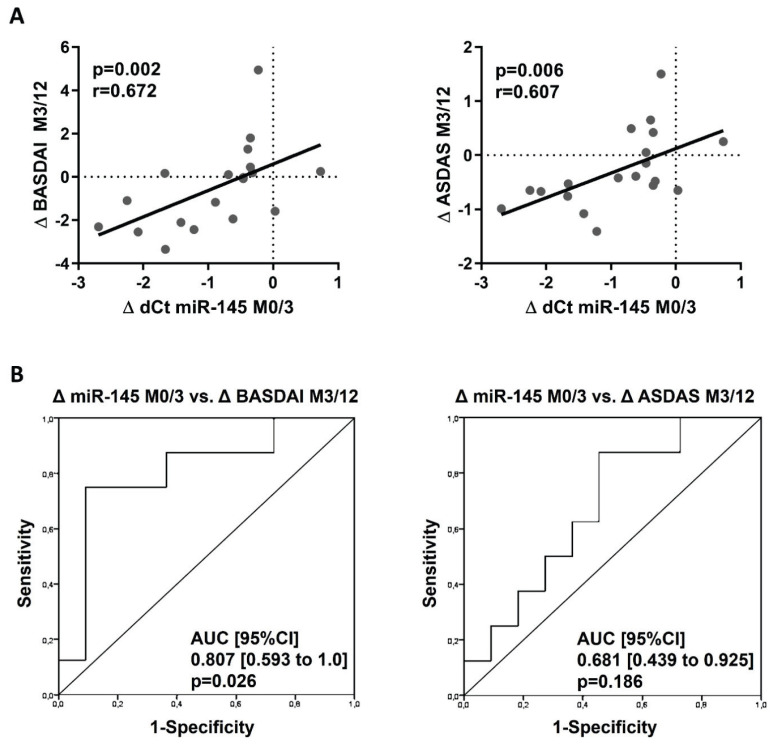
Fig. 3.
Relationship between the early change in miR-145 expression from month 0 to month 3 and further clinical improvement from month 3 to 12. (A) Correlation of decreasing in miR-145 expression from M0 to M3 with disease activity improvement from M3 to M12. (B) ROC curves analysis of the change in miR-145 expression from M0 to M3 as a predictor of disease activity improvement from M3 to M12 defined by BASDAI and ASDAS. Δ dCt miR–145 M0/M3 is calculated as M3–M0 (numbers <0 represent decreasing miRNA expression), Δ BASDAI, and Δ ASDAS M3/M12 are calculated as M12–M3 (numbers <0 represent the improvement of disease activity).

