
Figure 5.
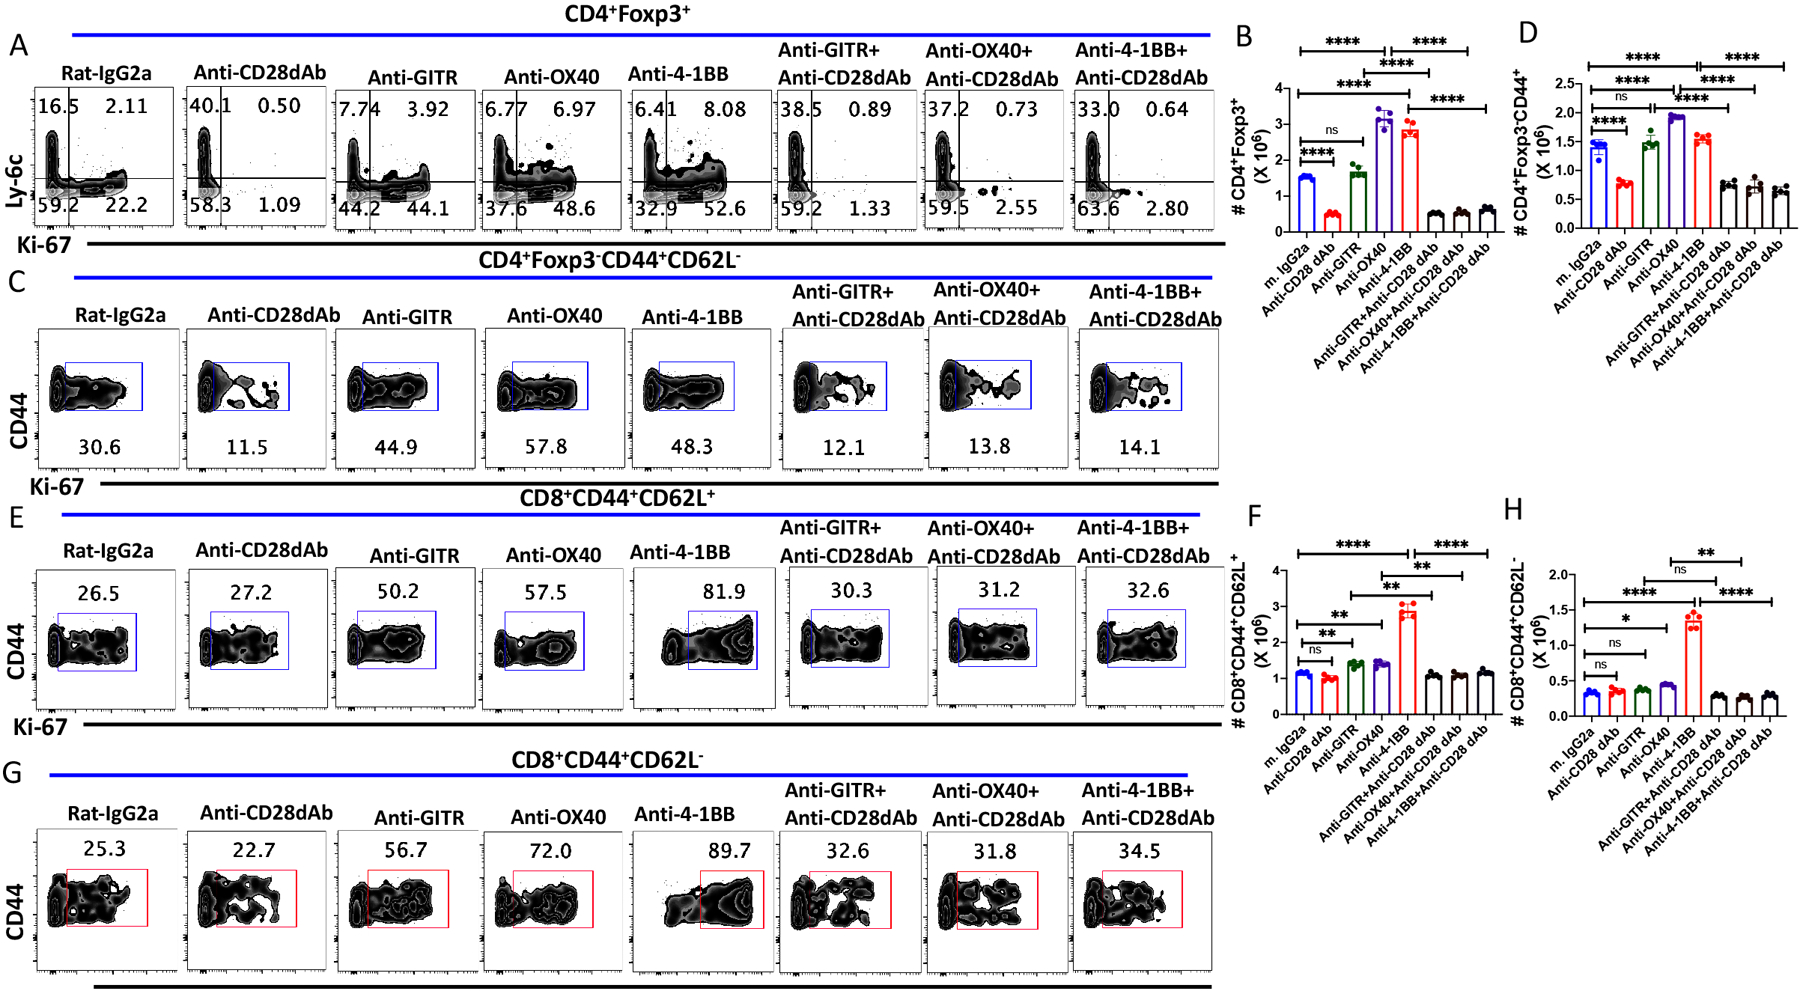
CD28 co-stimulatory signals modulate the effects of agonistic anti-TNFRSF mAbs in vivo. WT C57BL/6 mice were treated with either agonistic anti-GITR, anti-OX40, anti-4-1BB alone (250 μg/dose; i.p.) or together with anti-CD28 dAb (100 μg/dose; i.p.) every other d for six d and splenocytes were harvested on d 8. (A) Representative plots of Ly-6C versus Ki-67 expression on CD4+Foxp3+ Tregs. (B) Absolute number of splenic CD4+Foxp3+ T cells on d 8 after antibody treatment. (C) Representative plots of Ki-67 expression on CD4+Foxp3−CD44+CD62L− MP T cells after antibody treatment on d 8. (D) Absolute number of CD4+ MP T cells after antibody treatment. (E) Representative plot of Ki-67 expression on CD8+ CM T cells. (F) Absolute number of CD8+ CM T cells after antibody treatments. (G) Representative plot of Ki-67+ expresson on CD8+ EM T cells. (H) Absolute number of CD8+ EM T cells after antibody treatment. (A-H) represent the result of one experiment of two using five mice per group.