
Figure 1. Experimental setup and timeline.
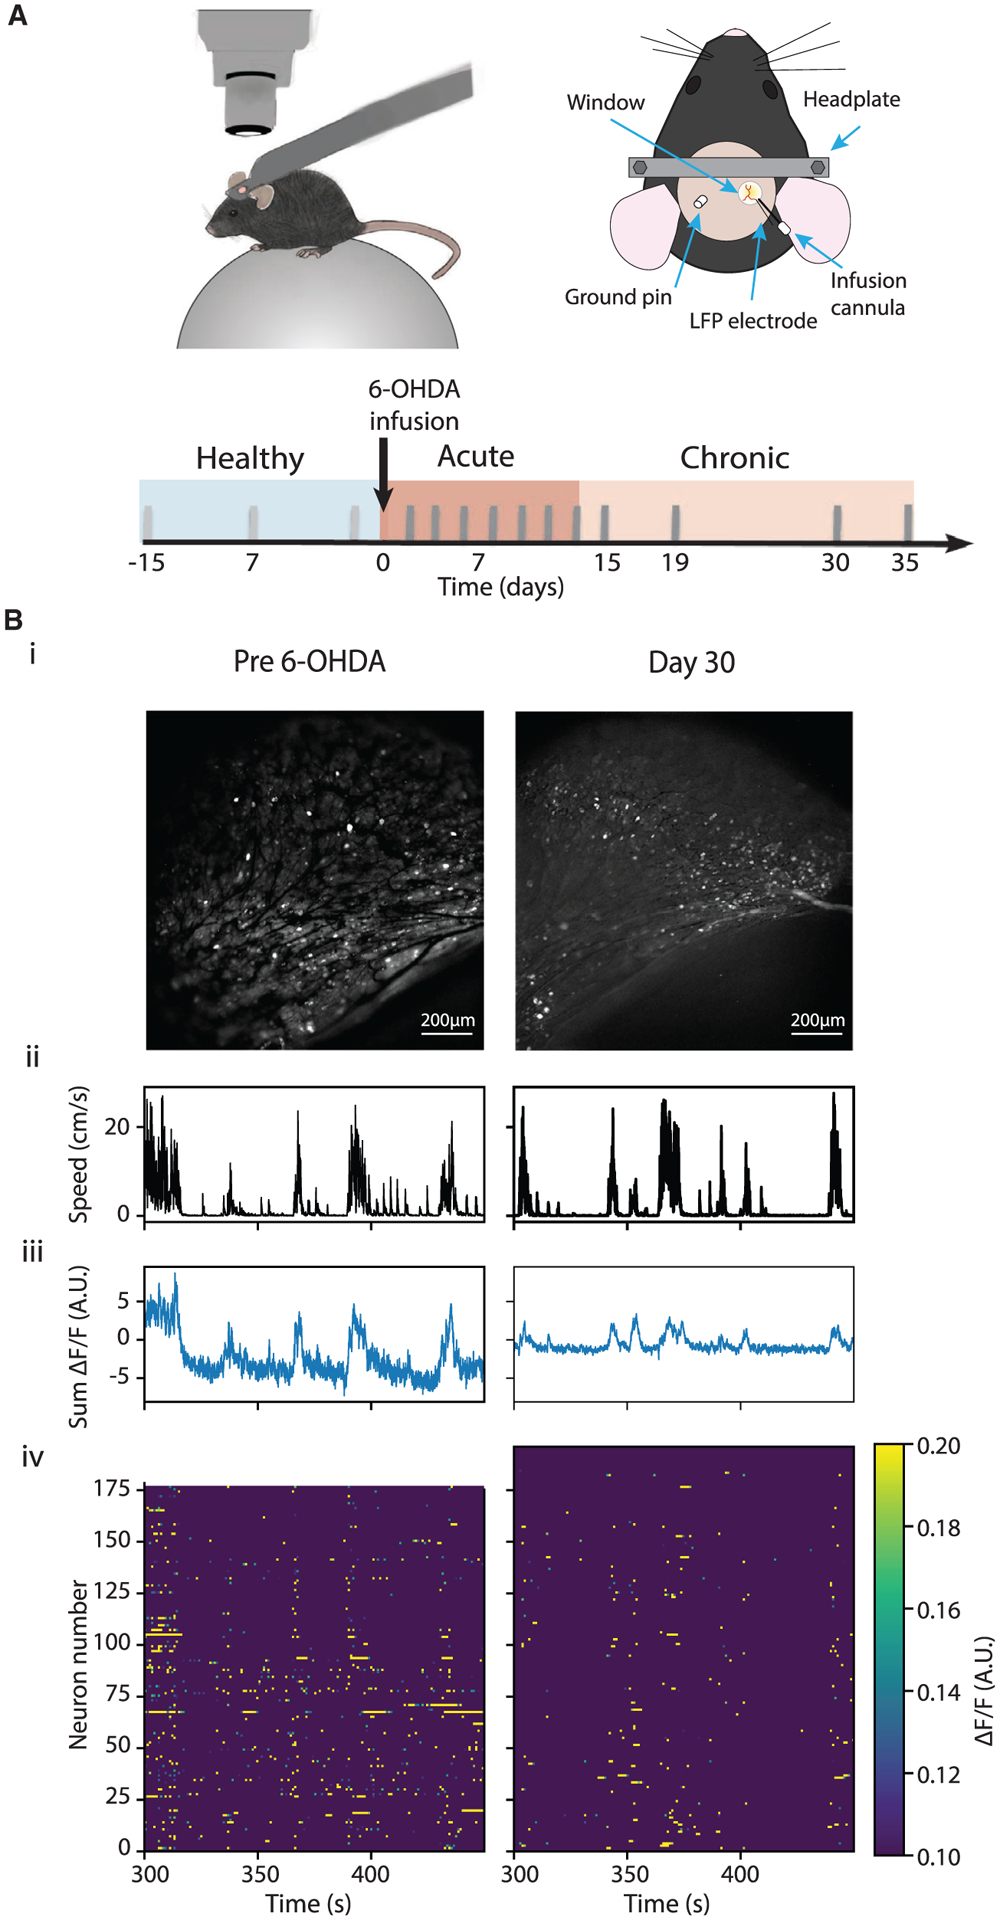
(A) Top: illustration of the experimental setup where a mouse is positioned under a microscope on the spherical treadmill (left), and the imaging window coupled with a LFP electrode and an infusion cannula (right). Bottom: experimental timeline. Three recording sessions, 5–7 days apart, were performed before 6-OHDA infusion in each animal, and multiple recording sessions were performed under the acute and chronic conditions.
(B) Example recording sessions from the same animal pre-6-OHDA infusion (left) and on day30 after 6-OHDA infusion (right). (i) A maximum-minimum GCaMP6 fluorescence intensity (ΔF/F) projection image, (ii-iv) movement speed, sum of ΔF/F of all neurons, and a heatmap of ΔF/F over an example session.