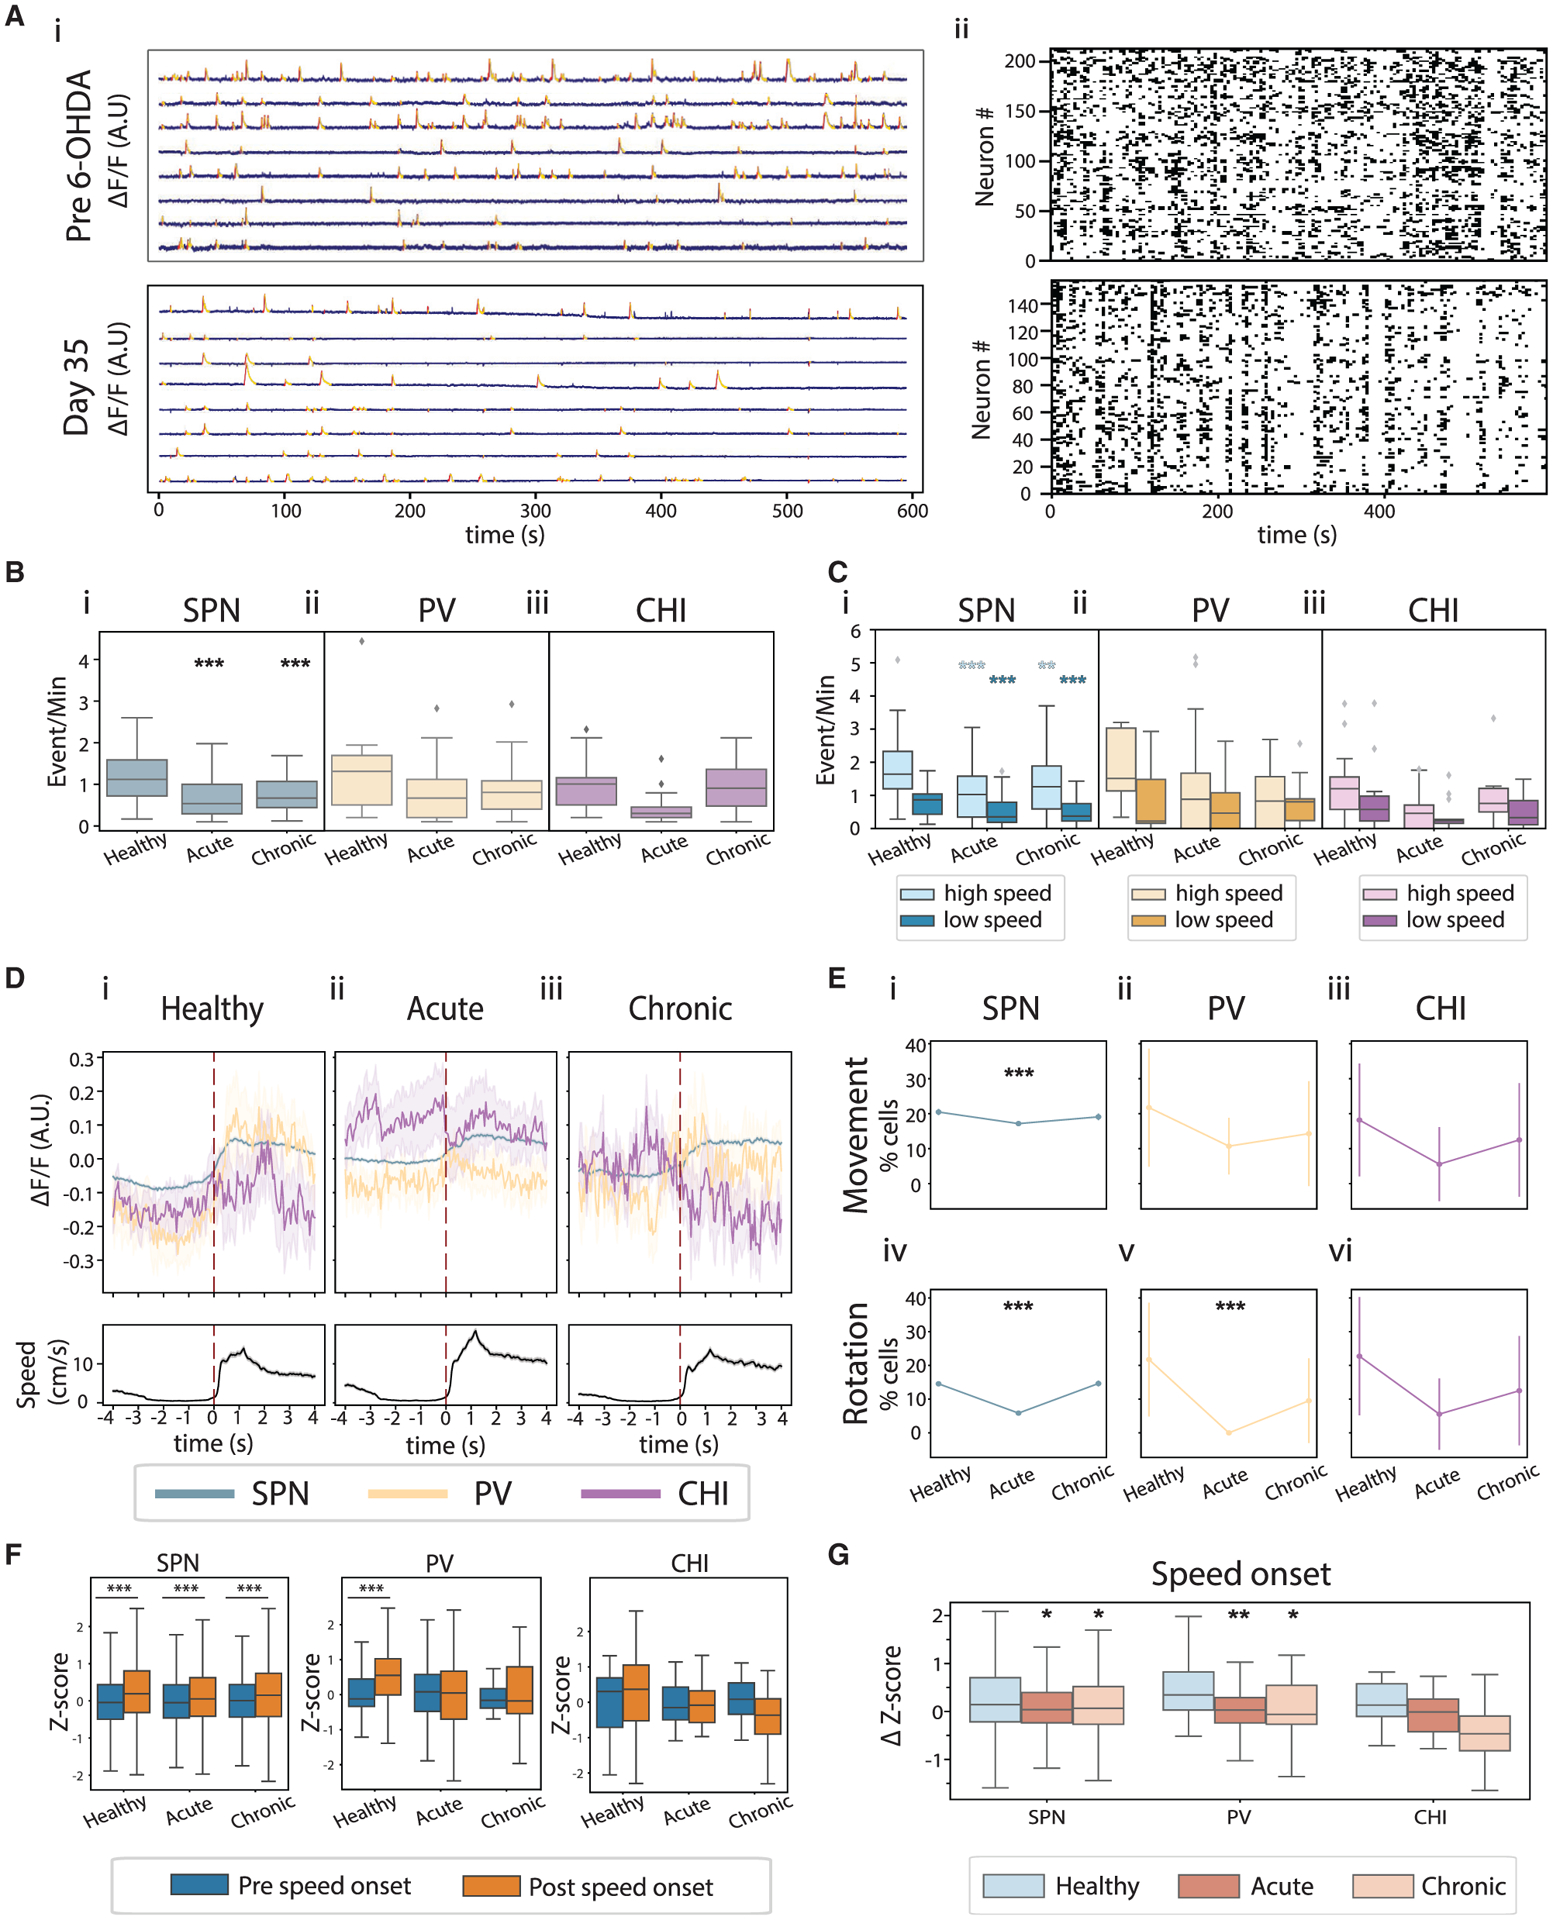
Figure 3. Dopamine depletion reduced locomotor encoding ability of SPNs and PVs, but not CHIs.

(A) Example GCaMP6 recordings before 6-OHDA infusion (top) and on day 30 after 6-OHDA infusion (bottom), from the same animal. (i) Example single-neuron GCaMP6 fluorescence traces (blue) with identified Ca2+ event rising (red) and falling phases (yellow) marked. (ii) Raster plots of binarized Ca2+ events from all neurons recorded in these sessions.
(B) Ca2+ event rates of SPNs (i), PVs (ii), and CHIs (iii) across conditions. SPN rates were significantly reduced in acute and chronic conditions (ANOVA, F(2,211) = 20.74, p = 6.05 × 10⁻⁹; mixed-effect model, acute versus healthy, t = −8.654, p = 1.69 × 10⁻¹⁵; chronic versus healthy, t = −5.767, p = 3.05 × 10⁻⁸). PV and CHI rates were not different across conditions (ANOVA for interaction of PV rate and conditions, F(2,80) = 2.035, p = 0.137; CHI rate and conditions, F(2,36) = 2.275, p = 0.117).
(C) Ca2+ event rates in high-speed and low-speed bouts for SPNs (i), PVs (ii), and CHIs (iii) across conditions. SPN rate was significantly decreased during high-speed and low-speed bouts (ANOVA for interaction of SPN rates during high-speed bouts and conditions, F(2,206) = 10.53, p = 4.41 × 10⁻⁵; mixed-effect model, acute versus healthy, t = −6.028, p = 7.92 × 10⁻⁹; chronic versus healthy, t = −3.149, p = 0.002. ANOVA for interaction of SPN rates during low-speed bouts and conditions, F(2,209) = 13.43 p = 3.25 × 10⁻⁶; mixed-effect model, acute versus healthy, t = −6.146, p = 4.26 × 10⁻⁹; chronic versus healthy, t = −4.664, p = 5.70 × 10⁻⁶).
(D) Population GCaMP6 fluorescence of SPNs (blue), PVs (yellow), and CHIs (purple) aligned with speed onset (top), and the corresponding movement speed (bottom).
(E) Percentage of speed- (top) and rotation- (bottom) responsive SPNs, PVs, and CHIs. Significantly fewer SPNs were movement responsive under the acute condition (Fisher’s exact test with Bonferroni correction for multiple comparisons: movement-responsive SPNs, 1,690/9,850 in acute versus 1,604/7,837 in healthy, p = 2.13 × 10⁻⁸; 1,248/6,539 in chronic versus 1,604/7,837 in healthy, p = 0.04; rotation-responsive SPNs, 577/9,850 in acute versus 1,140/7,837 in healthy, p = 1.39 × 10−83; 957/6,539 in chronic versus 1,140/7,837 in healthy, p = 0.887). Only rotation-responsive PVs were reduced after dopamine depletion (movement-responsive PVs, 6/56 in acute versus 5/23 in healthy, p = 0.282; 3/21 in chronic versus 5/23 in healthy, p = 0.701; rotation-responsive PVs, 0/56 in acute versus 5/23 in healthy, p = 0.001; 2/21 in chronic versus 5/23 in healthy, p = 0.416). There was no change in responsive CHIs (movement-responsive CHIs, 1/18 in acute versus 4/22 in healthy, p = 0.36; 2/16 in chronic versus 4/22 in healthy, p = 1; rotation-responsive CHIs, 1/18 in acute versus 5/22 in healthy, p = 0.197; 2/16 in chronic versus 5/22 in healthy, p = 0.675).
(F) Z scores of population responses during the 4-s period before versus after movement onset for SPNs (left), PVs (middle), and CHIs (right) (two-tailed paired t tests: SPN, healthy, t = 27.55, p = 1.08 × 10−159; acute, t = 18.19, p = 3.82 × 10−73; chronic, t = 18.94, p = 1.89 × 10−78; PV, healthy, t = 3.76, p = 6.80 × 10⁻⁴; acute, t = 1.39, p = 0.166; chronic, t = 1.35, p = 0.187; CHI, healthy, t = 1.015, p = 0.32; acute, t = 0.346, p = 0.732; chronic, t = 1.28, p = 0.212).
(G) Change in Z scores of population fluorescence of SPNs, PVs, and CHIs at speed onset (ANOVA: SPN, F(30,539,2) = 68.05, p = 3.25 × 10⁻³⁰; PV, F(181,2) = 4.24, p = 4.89 × 10⁻⁴; CHI, F(83,2) = 1.55, p = 0.21. Tukey’s honest post hoc test: SPN, acute versus healthy, p = 0.001; chronic versus healthy, p = 0.001; PV, acute versus healthy, p = 0.001; chronic versus healthy, p = 0.043). Boxplot details are as in Figure 2. *p < 0.05, **p < 0.01, ***p < 0.001.
