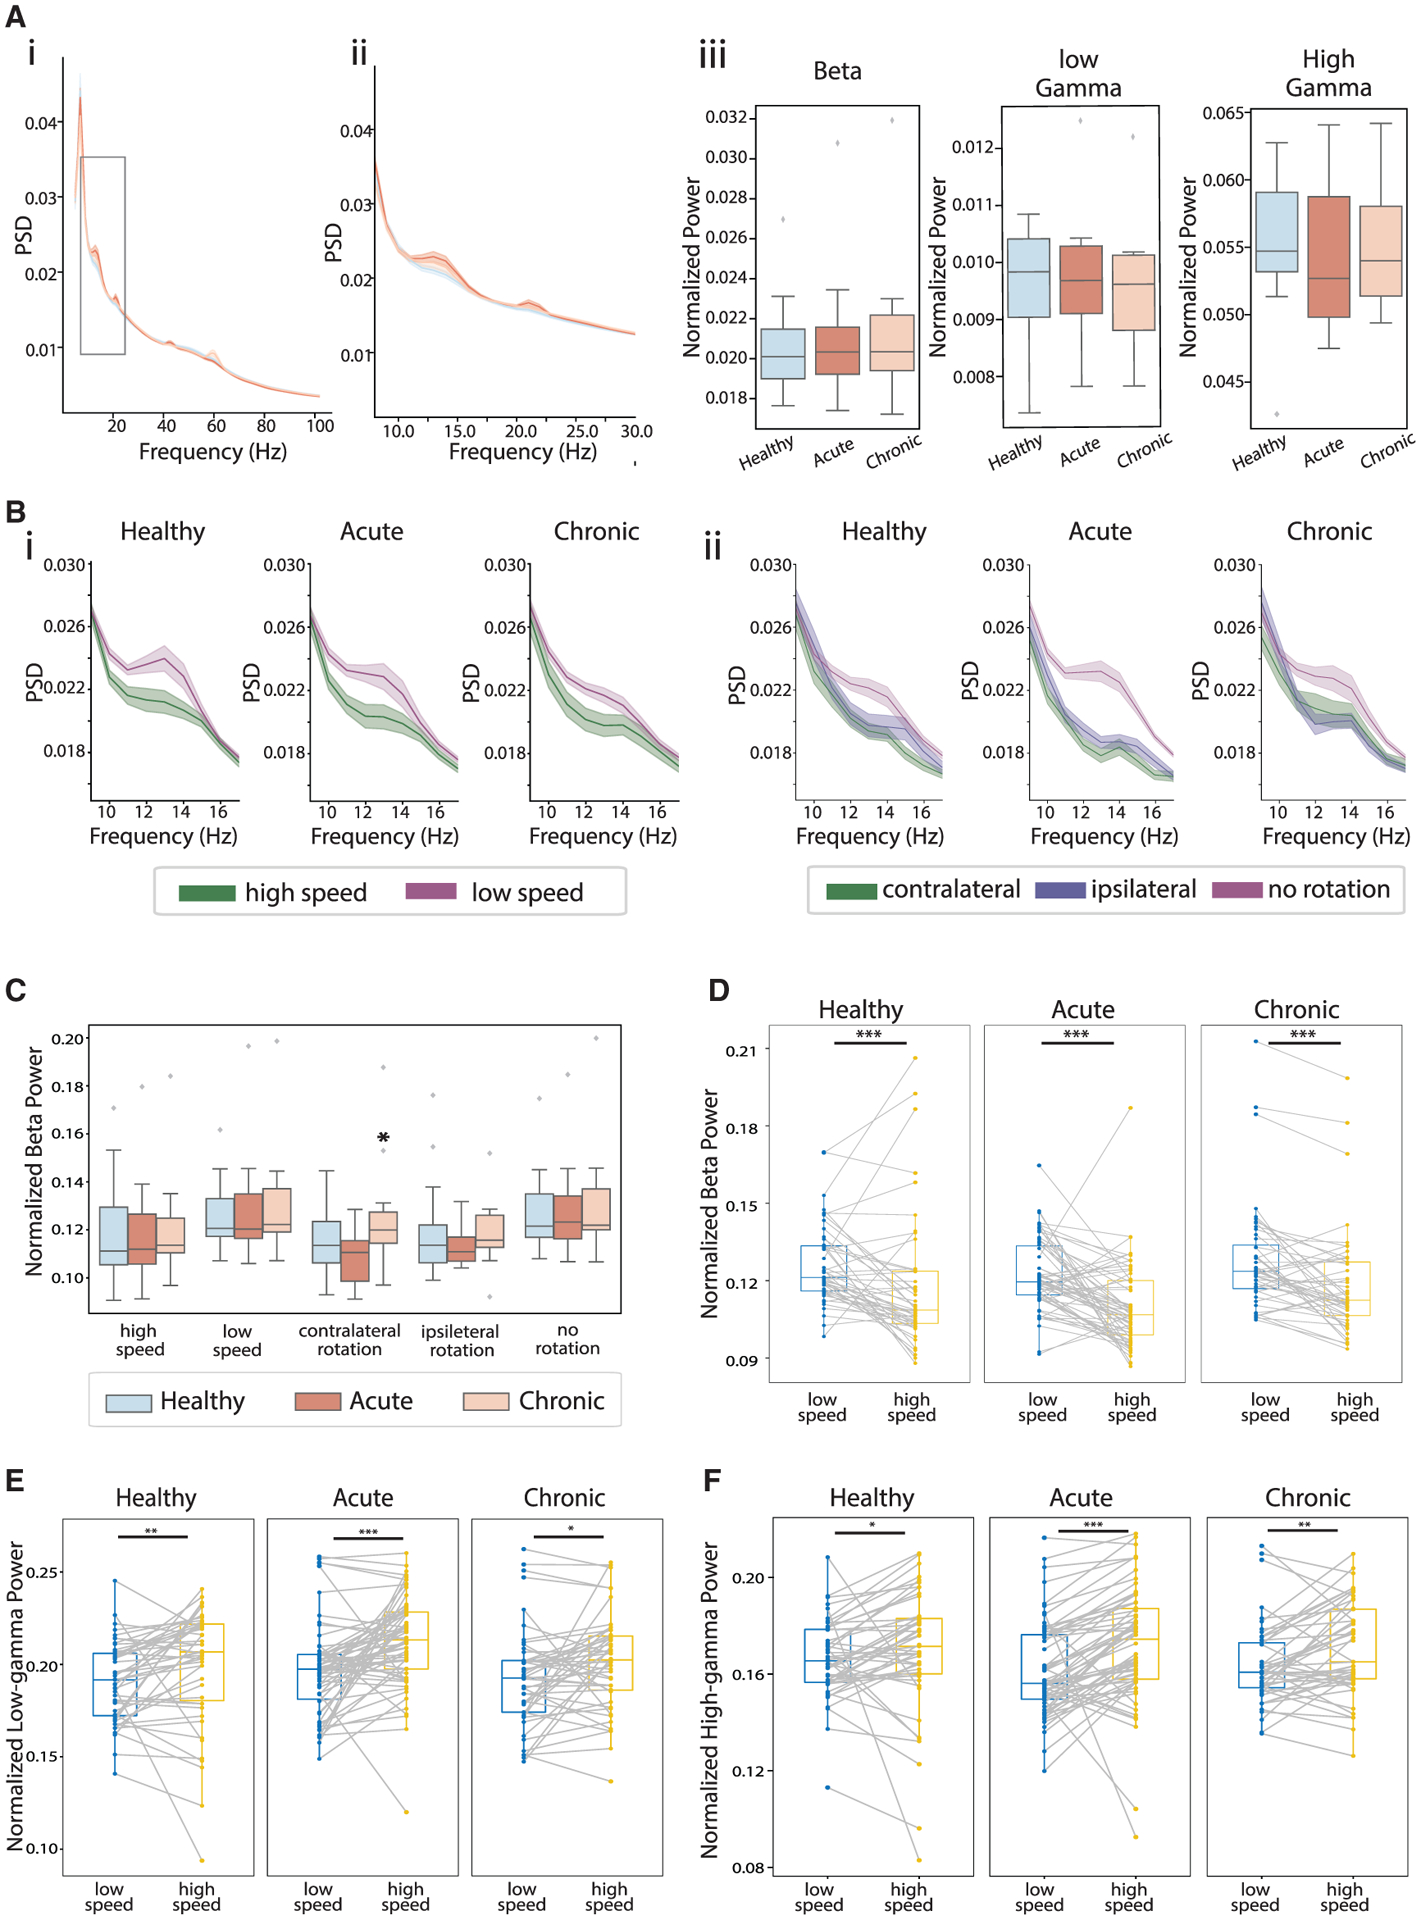
Figure 4. Locomotion differentially modulated striatal LFP oscillations, and dopamine depletion selectively augmented beta oscillations during impaired locomotion bouts.

(A) Mean LFP power spectrum density (PSD) across sessions in healthy (blue), acute (dark orange), and chronic (light orange) conditions (i) and zoom-in view around beta (10–15 Hz) frequencies (ii). LFP power at beta, low-gamma (40–60Hz), and high-gamma (60–100) frequencies (iii). There was no significant differences across conditions (ANOVA for interaction of beta power and conditions, F(2,210), p = 0.360; low-gamma power and conditions, F(2,210), p = 0.419; high-gamma power and conditions, F(2,210), p = 0.222).
(B) LFP PSD at the beta frequencies in high-speed (green) and low-speed bouts (purple), across conditions (i). Same as (i), but during contralateral-rotation bouts (green), ipsilateral-rotation bouts (blue), and no-rotation bouts (purple).
(C) Beta power during different movement bouts. The only significant difference was the increase in beta power during contralateral rotation under the chronic condition (ANOVA, F(2,159) = 3.698, p = 0.027; mixed-effect model, acute versus healthy, t = −0.344, p = 0.732; chronic versus healthy, t = 2.014, p = 0.045).
(D) Beta power during low-speed (blue) versus high-speed bouts (yellow) across sessions in healthy (left), acute (middle), and chronic conditions (right) (Wilcoxon signed-rank test: high-speed versus low-speed bouts, healthy, p = 7.6 × 10⁻⁴; acute, p = 5.7 × 10⁻⁶; chronic, p = 2.3 × 10⁻⁵).
(E) Same as (D) but for low-gamma power (healthy, p = 0.006; acute, p = 2.8 × 10⁻⁵; chronic, p = 0.028).
(F) Same as (D) but for high-gamma power (healthy, p = 0.021; acute, p = 5.7 × 10⁻⁶; chronic, p = 0.006). *p < 0.05, **p < 0.01, ***p < 0.001.
