
Figure 6. Dopamine loss led to a transient increase in LFP high-gamma oscillations during SPN and PV activation, but not CHI activation.
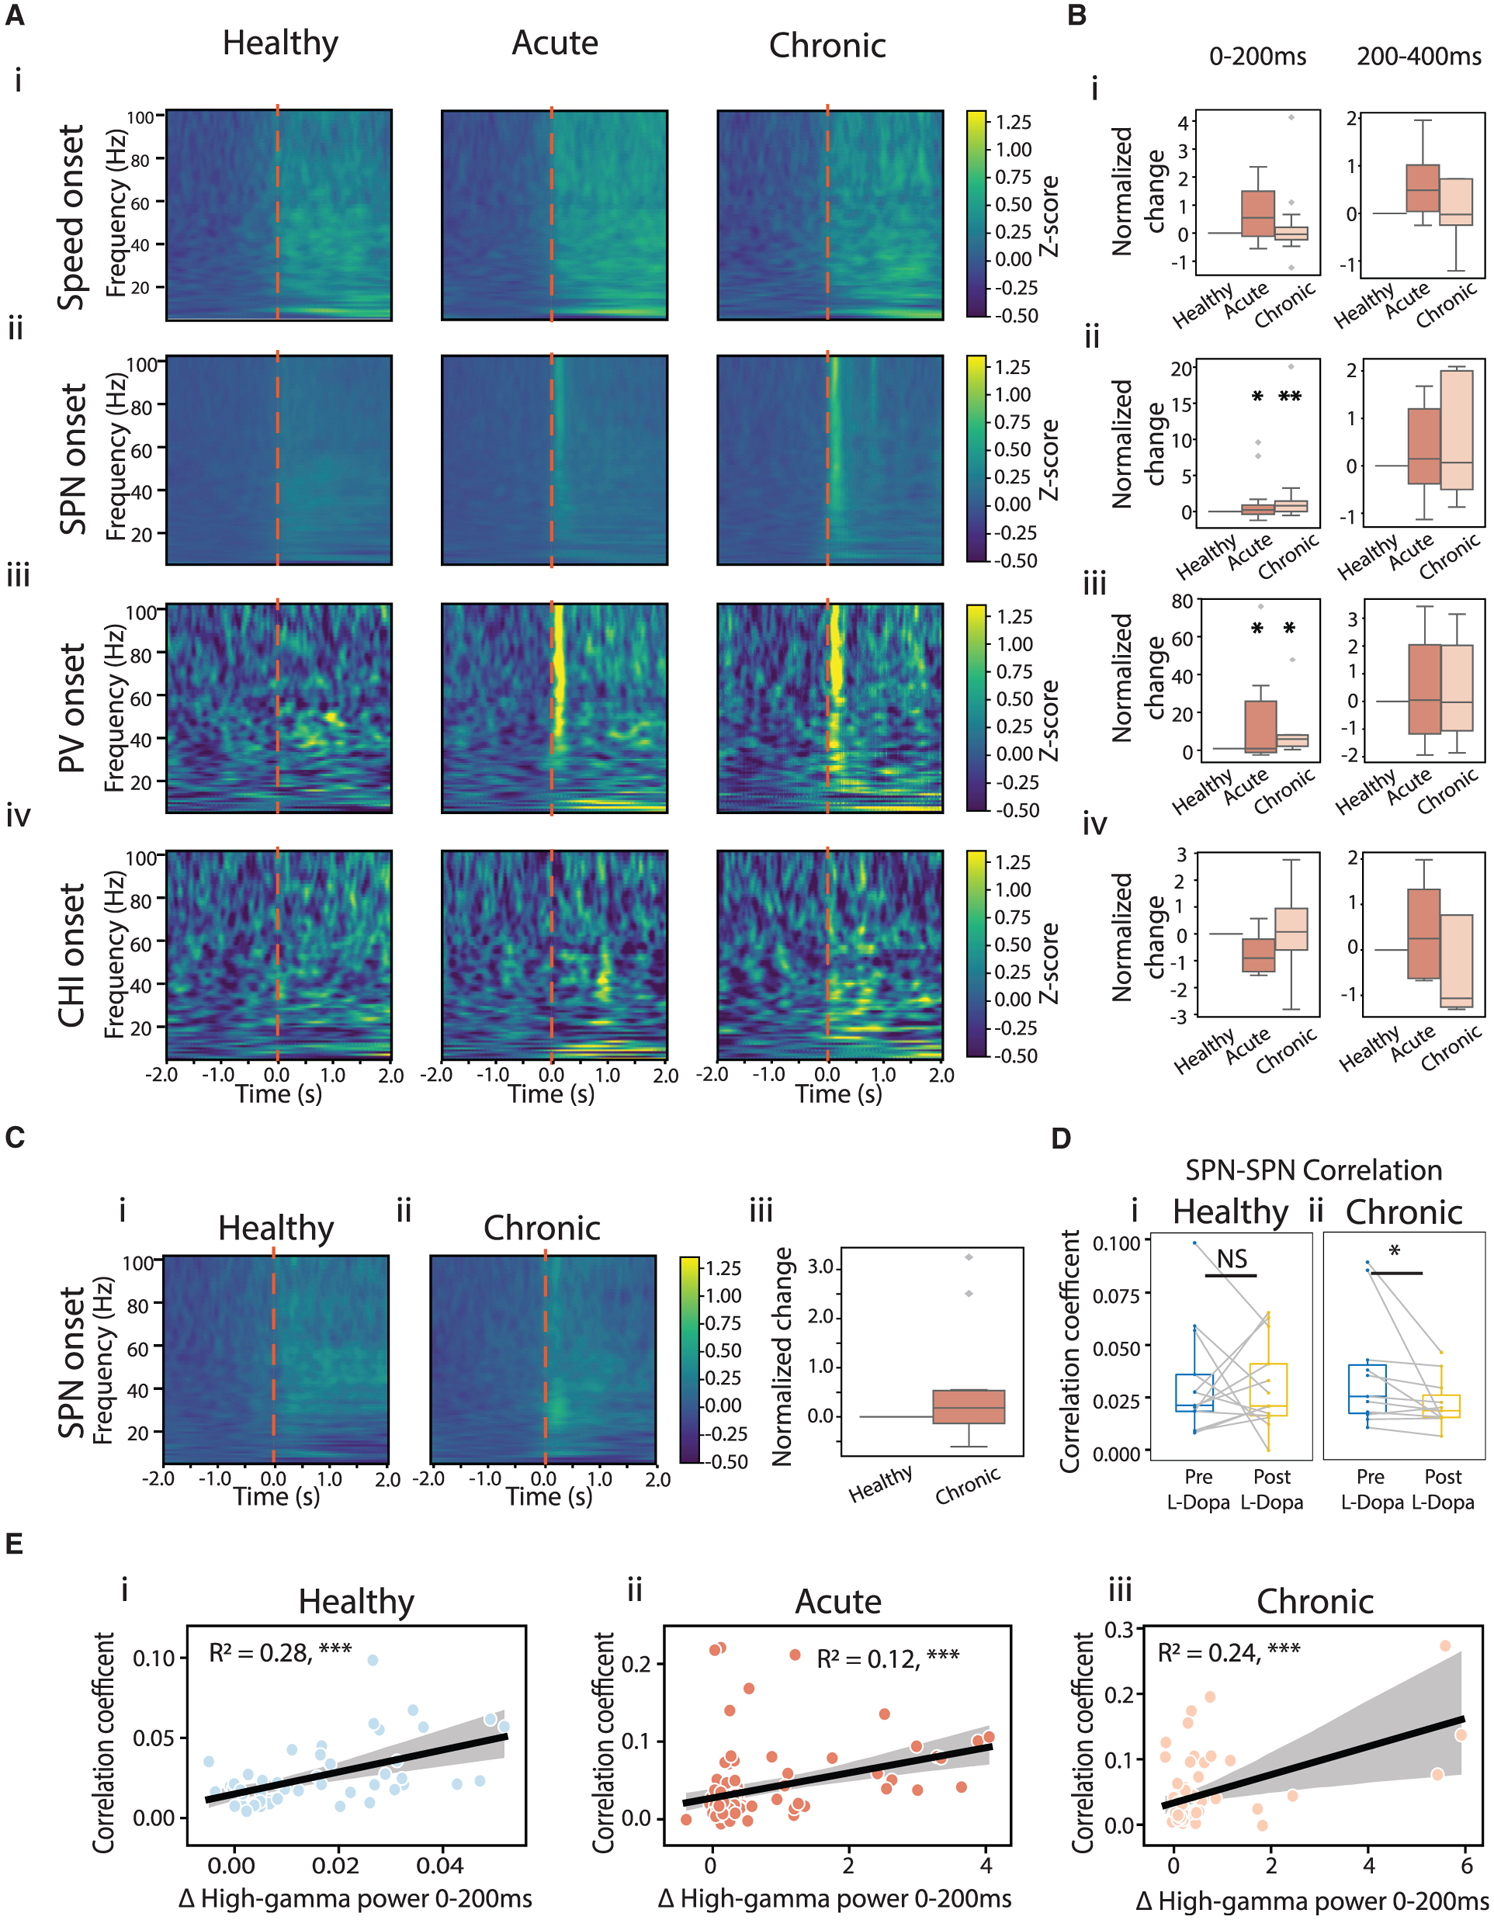
(A) LFP power spectrum aligned to movement onset (i), SPN Ca2+ event onset (ii), PV event onset (iii), and CHI event onset (iv) across conditions. Shown are Z scored power spectra, normalized across all events in all mice.
(B) Changes in high-gamma power (60–100 Hz) in the 0–200 ms (left) and 200–400 ms (right) windows following the corresponding event onsets, normalized to the change observed under the healthy condition (ANOVA for interaction of high-gamma power following SPN onset and conditions: F(2,206) = 4.961, p = 0.007; mixed-effect model, acute versus healthy, t = 2.168, p = 0.031; chronic versus healthy, t = 3.139, p = 0.002. ANOVA for high-gamma power following PV onset and conditions: F(2,53) = 4.021, p = 0.024; mixed-effect model, acute versus healthy, t = 2.547, p = 0.014; chronic versus healthy, t = 2.58, p = 0.013).
(C) LFP power spectrum aligned to SPN event onset post L-Dopa administration under healthy (i) and chronic conditions (ii), and changes in high-gamma power within 0–200 ms of SPN event onset (iii). No difference was observed (ANOVA, F(1,88), p = 0.085).
(D) PCC across all SPN-SPN pairs before (blue) and after (yellow) L-Dopa administration, under healthy (left) and chronic conditions (right). L-Dopa significantly decreased PCC of SPN-SPN pairs under the chronic condition (Wilcoxon signed-rank, p = 0.014), but not under the healthy condition (p = 1).
(E) High-gamma oscillation power within 0–200 ms of SPN event onsets versus PCC of correlated SPN-SPN pairs across sessions. Black lines indicate linear regression. *p < 0.05, **p < 0.01, ***p < 0.001.